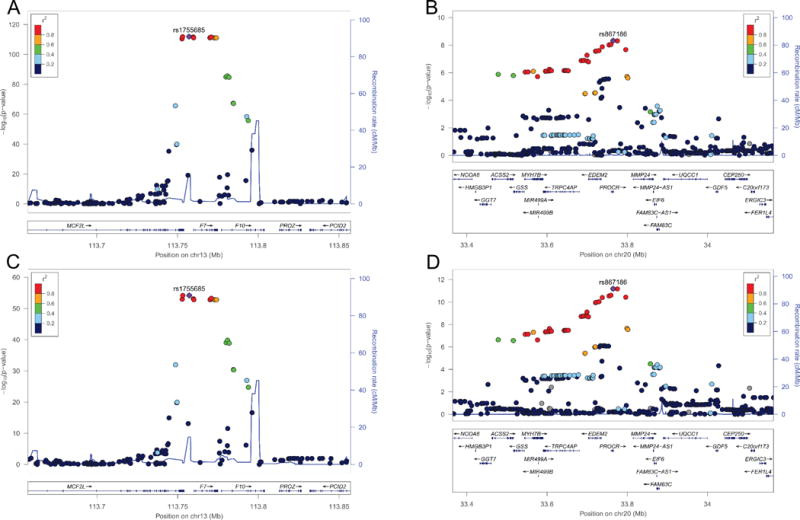
Figure 1.

FVIIa and FVIIa-AT regional association plots for chromosome 13 and chromosome 20 in European-Americans. FVIIa (A & B) and FVIIa-AT (C & D) regional association plots for the chromosome 13q34 (A & C) and chromosome 20q11.2 (B & D) loci are presented. The colors of each single nucleotide polymorphism (SNP) indicate pairwise linkage disequilibrium (LD) relative to the lead SNP in the region. SNPs with missing LD information are shown in gray. LD was based on r-squared values calculated using 1000 Genomes (March 2012 EUR) LD for European-Americans. Plots were generated using LocusZoom [60].
