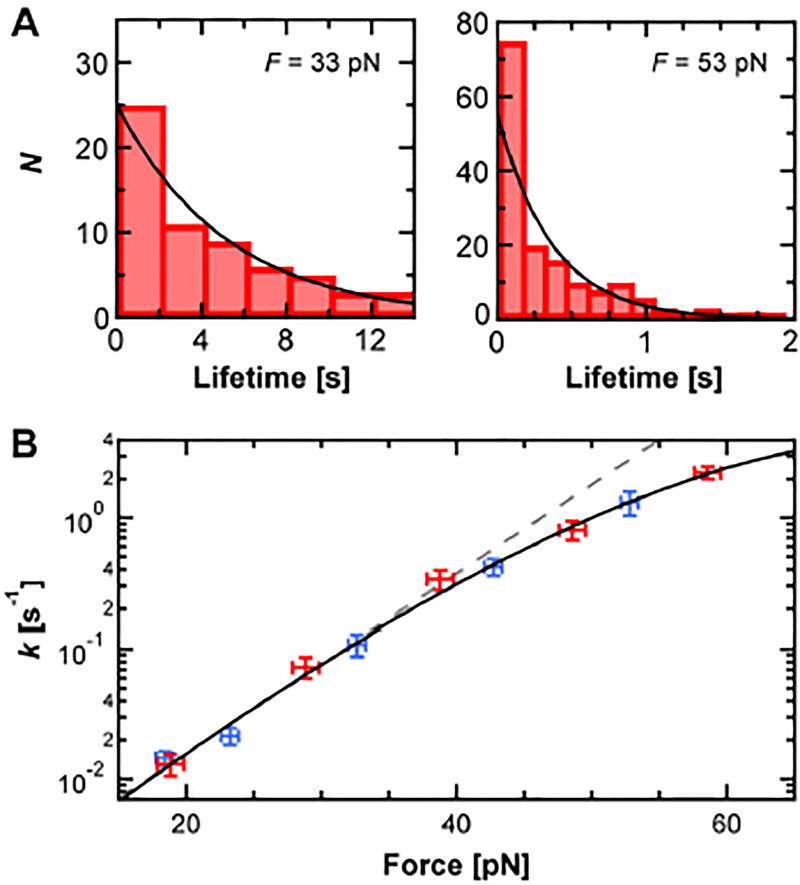
Figure 2.
Quantifying DIG10.3•Dig under force. A) Histograms of DIG10.3•Dig lifetime at two different forces (33 and 53 pN, N = 65 and 159 respectively) were analyzed by fitting to an exponential (black line). B) The dissociation rate constant k as a function of F shows curvature on a log-linear plot. Two data sets taken on consecutive days are shown (red and blue). The resulting data was fit to the Dudko model (Eq. 1, black line). Error bars represent the standard error of k (N ≈ 50–250 per point; Ntotal = 1,081) and standard deviation of F. Gray dashed line represents a Bell-Evans fit to the data below 40 pN.

