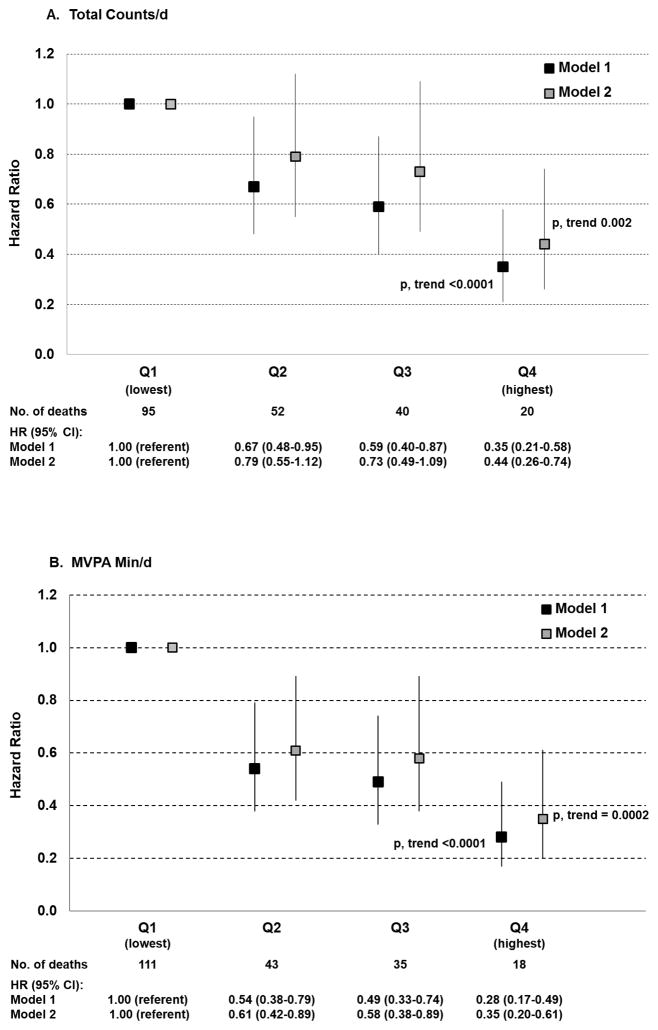
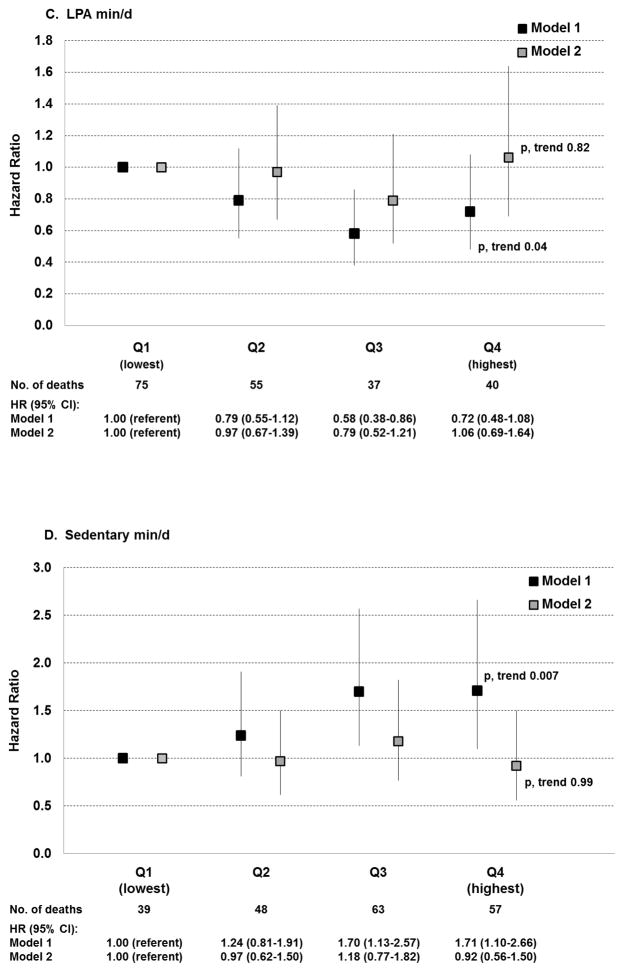
Figure. Hazard Ratios (HR) and 95% Confidence Intervals (CI) for All-Cause Mortality by Physical Activity and Sedentary Behavior.
Hazard ratios are for quartiles of triaxial accelerometer-assessed: A. total counts/d (measure of total PA); B. moderate-to-vigorous intensity physical activity (MVPA) min/d; C. light-intensity physical activity (LPA) min/d; D. sedentary min/d.
Vertical lines represent 95% confidence intervals. Model 1 is adjusted for age and wear time. Model 2 is additionally adjusted for smoking; alcohol; intakes of saturated fat, fiber, fruits and vegetables; hormone therapy; parental history of myocardial infarction; family history of cancer; general health; history of cardiovascular disease; history of cancer; cancer screening. Analyses of MVPA and LPA are mutually adjusted; analyses of sedentary behavior also are adjusted for MVPA.


