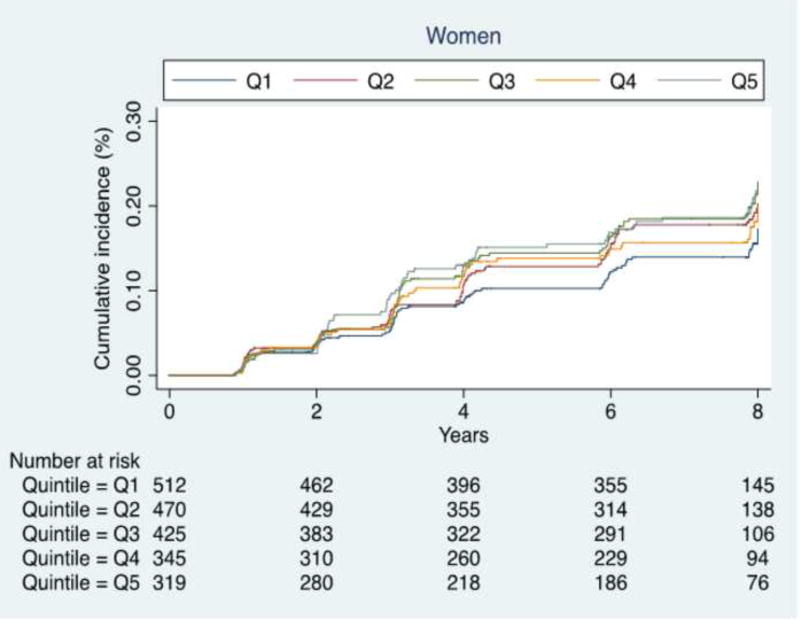
Figure 1. Risk of fractures in women by dietary inflammatory index quintiles at baseline, Osteoarthritis Initiative (OAI), 2004–6.
Q1 indicates participants having the lowest dietary inflammatory index values; Q5 the highest. P values shown are for trends and were calculated using the Jonckheere-Terpstra test for continuous variables.

