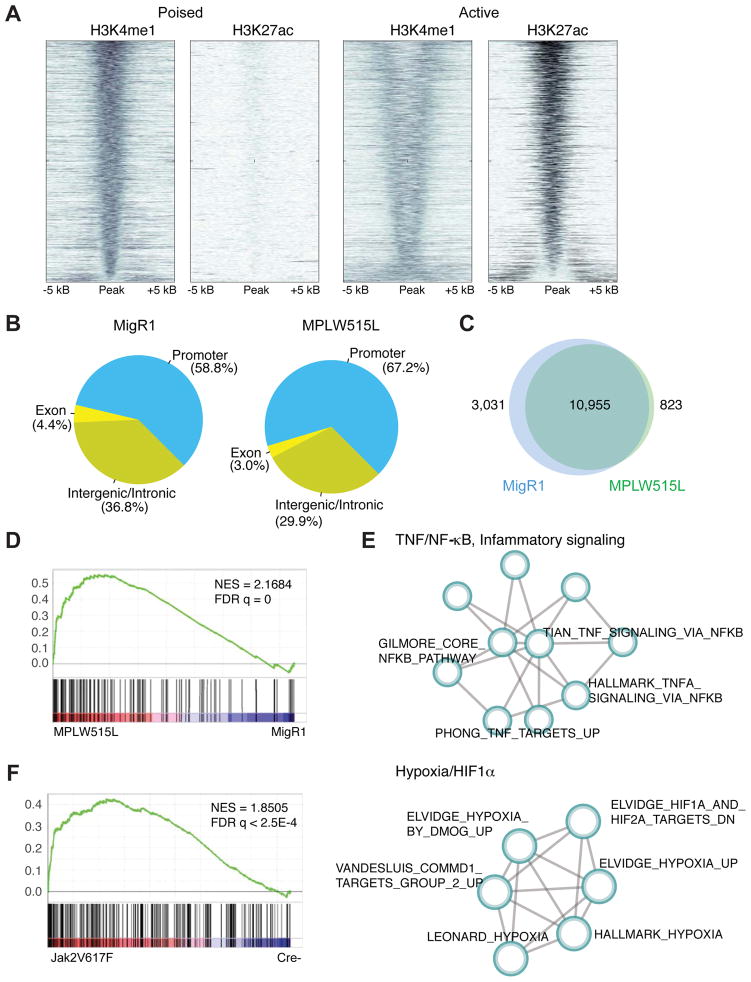
Figure 1. Alterations in the cis-regulatory landscape of MPN cells.
A) Density of ChIP-seq reads for H3K4me1 and H3K27ac relative to midpoint at putative poised and active enhancers. Data from sorted MPLW515L-positive MEPs is shown. n=3/mark. B) Distribution (%) of H3K27ac and H3K4me1 peaks over the promoters (5 kb upstream of TSS), coding exons, intronic and distal intergenic regions. Data from GFP-positive MEPs sorted from healthy (MigR1) or MPLW515L-diseased mice are shown. C) Number of differentially enriched ChIP-seq peaks in MF progenitors in comparison to controls. D) GSEA pathways analysis of H3K27ac data (TSS) from MPLW515L-positive MEPs compared to control (MigR1). NES, normalized enrichment score; FDR, false-discovery rate. E) Optimized gene sub-network identified from the analysis of H3K27ac ChIP-seq data from control and MPLW515L-positive MEPs. F) GSEA pathways analysis of H3K27ac data (TSS) from JAK2V617F-positive MEPs compared to control (Cre-). NES, normalized enrichment score; FDR, false-discovery rate. See also Figure S1 and Table S1.

