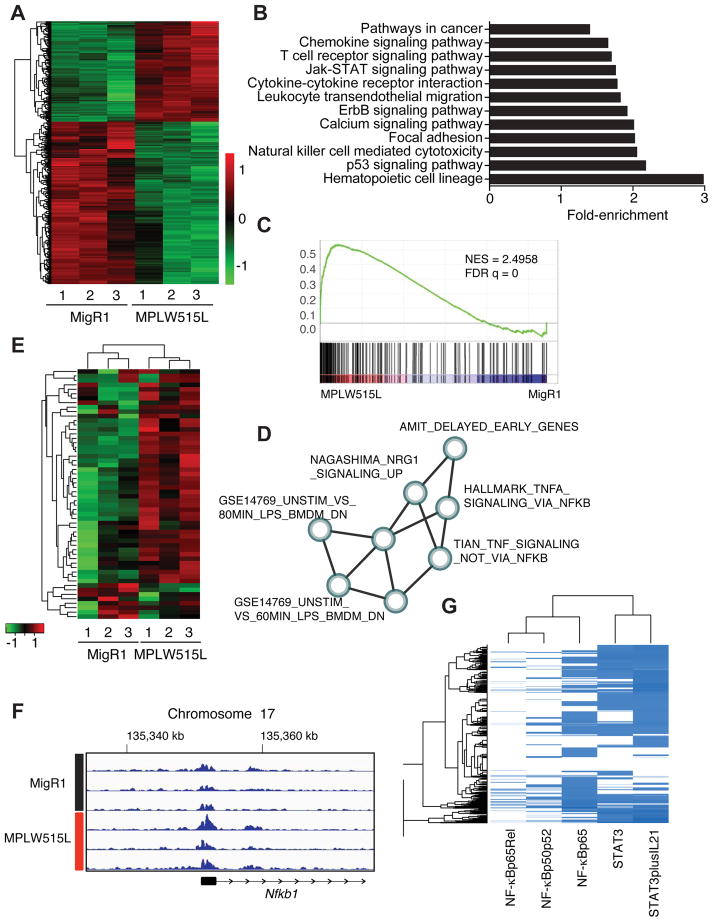
Figure 2. TNF/NF-κB signaling axis represents a central signaling node in MF progenitors.
A) Hierachical clustering of differentially expressed genes from control and MPLW515L-positive MEPs. Adjusted p value <0.01 (Wald test) and abs(log2FoldChange)>1. Green: negative values, red: positive values. n=3/group. B) KEGG pathway enrichment analysis of differentially expressed genes. x-axis shows fold enrichment in MPLW515L-positive MEPs compared to control. p value <0.01. C) GSEA pathways analysis of DEGs from MPLW515L-positive MEPs compared to control (MigR1). NES, normalized enrichment score; FDR, false-discovery rate. Kolmogorov-Smirnov test. D) Optimized gene expression sub-network identified from gene expression profiles. Detailed information about the creation of sub-networks and a list of gene sets can be found in STAR Methods, Figure S2 and Table S1. E) Heatmap depicting expression of core genes that accounts for the HALLMARK_TNFA_SIGNALING_VIA_NFKB gene set enrichment signal. MigR1: control MEPs from empty vector transplanted mice, MPLW515L: mutant MEPs isolated from MF mice. n=3. F) ChIP-sequencing tracks for H3K27ac at the Nfkb1 gene locus for MF progenitors (MPLW515L) and control cells (MigR1). Numbers indicate the genes location on chromosome 17. G) Analysis of the co-occurrence between canonical STAT3 (2 sites) and p65/NF-κB (3 sites) transcription factor bindings sites in the regulatory regions of the DEGs in MPLW515L-positive MEPs. See also STAR Methods, Figure S2, and Tables S2 and S3.

