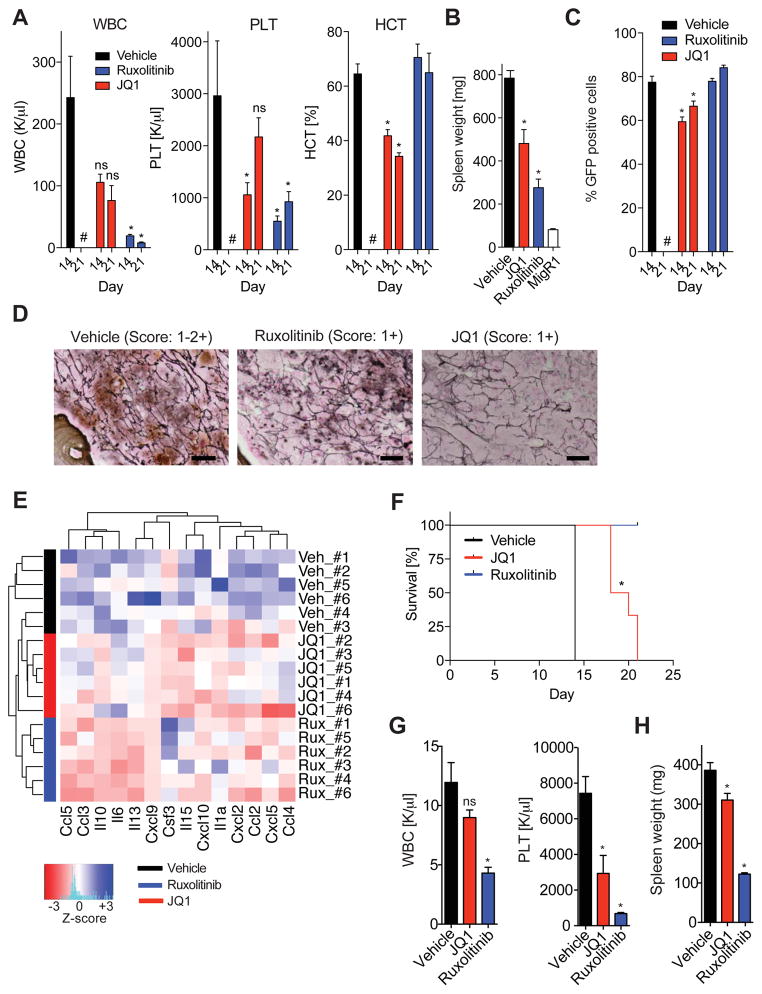
Figure 4. JQ1 monotherapy shows therapeutic efficacy in MPN in vivo.
A) White blood cell counts (WBC, K/μl), platelet counts (PLT, K/μl), and hematocrit levels (HCT, %) of MPLW515L-diseased mice treated with vehicle, ruxolitinib, or JQ1 at 14 days and 21 days. Representative data from two independent experiments are shown with 4–6 mice per treatment condition. #, no data for vehicle-treated mice at 21 days available. *p value <0.05. B) Bar graph showing spleen weights (mg) of MF mice treated with vehicle, ruxolitinib, or JQ1 for 21 days. n=4–6 mice/condition. Data are representative of two independent experiments. *p value <0.05. C) Percentage of GFP-positive cells in the PB of MF mice treated with vehicle, ruxolitinib, or JQ1. Frequencies measured at 14 and 21 days are shown. *p value <0.05. #, no data for vehicle-treated mice at 21 days available. D) Representative images showing reduced reticulin fibrosis in the BM of MF mice treated with ruxolitinib or JQ1 compared to vehicle control mice. n=3 mice per group. Scale bar, 10 μM. E) Serum cytokine levels of MF mice treated with vehicle, ruxolitinib, or JQ1 for 21 days. Color bars indicate treatment group. Heatmap shows z-scores. F) Kaplan-Meier survival analysis (%) of MPLW515L-diseased mice treated with vehicle, ruxolitinib, or JQ1. *p value <0.05 (log-rank test). n=6/condition. G, H) JAK2V617F-diseased mice treated with vehicle, ruxolitinib (60 mg/kg, BID), or JQ1 (50 mg/kg, QD), for 28 days. WBC counts (K/μl) and PTL levels (K/μl). (G) Spleen weights. (H) n=5 mice/condition. *p value <0.05. ns, not significant. Data represent mean values ± S.E.M. The Student’s t-test (unpaired, two-tailed) was used to compare the mean of two groups. See also Figure S4.

