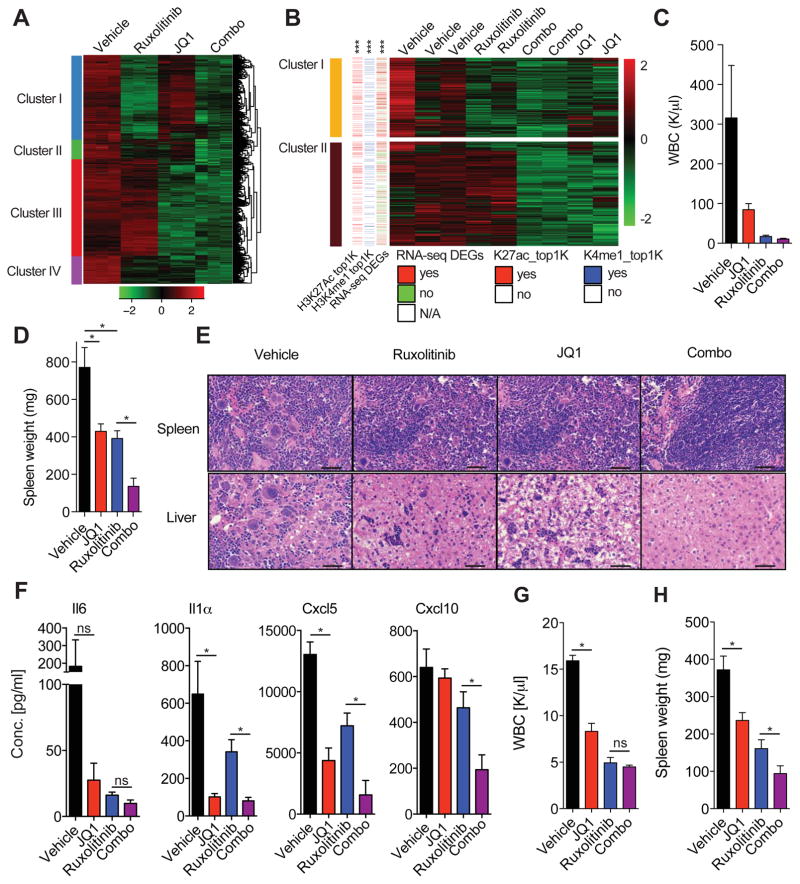
Figure 5. RNA-sequencing analysis reveals inhibitory effect of JQ1 on TNF/NF-κB signaling network.
A) Hierarchical clustering analysis of RNA-sequencing data (z-score of VOOM-normalized read counts, with green negative values and red positive values) from indicated SET-2 samples. Depicted heatmap only shows genes which are downregulated by ruxolitinib/JQ1 combination therapy compared to DMSO control cells (FDR<0.05, log2-fold change greater than 1 or smaller than −1 according to a two class linear model generated following limma standard recommandations). Data from biological triplicates are shown. List of select enriched biological process Gene Ontology (GO) terms for each cluster can be found in Table S4. B) Heatmap depicting RNA-seq data for indicated samples (absolute fold change > 2, FDR-adjusted p-value < 0.01). Color code indicates whether a gene contains a H3K27ac (red: yes, white: no) or H3K4me1 peak (blue: yes, white: no) belonging to the top 1000 significant differential peaks (K27ac_top1K and H3K4me1, respectively) or is differentially expressed (DEGs, red: yes, green: no, white: N/A). ***p value <1e-6 (overlap significance). Clusters 3–5 are presented in Figure S5. C) WBC counts (K/μl) of MPLW515L-diseased mice treated for 14 days. D) Bar graph showing spleen weights (mg) of animals treated for 21 days (vehicle and JQ1) or 28 days (ruxolitinib and combo). n=4–5. *p value <0.05. Data is representative of three independent experiments. E) Representative images showing H&E stain of spleen and liver from MF mice treated for 21 days (vehicle and JQ1) or 28 days (ruxolitinib and combo). Data shown are representative of three independent experiments with 4–5 mice per group. Scale bar, 50 μM. F) Serum cytokine levels of MF mice treated for 21 days (vehicle and JQ1) or 28 days (ruxolitinib and combo). n=4–5/group, *p value <0.05. G, H) JAK2V617F-diseased mice treated with vehicle, JQ1, ruxolitinib, or the combination for 28 days. WBC. (G) Spleen weights. (H) n=3–6 mice per group, *p value <0.05, ns, not-significant. Data represent mean values ± S.E.M. The Student’s t-test (unpaired, two-tailed) was used to compare the mean of two groups. See also Figure S5 and Table S4.

