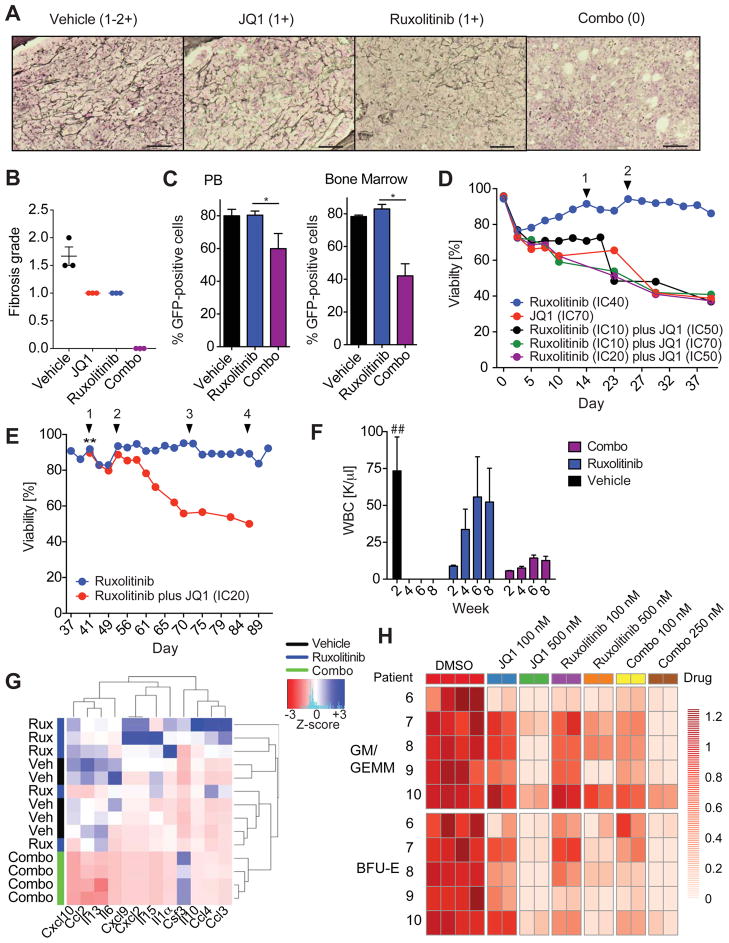
Figure 6. Combined JAK/BET inhibition reverses BM fibrosis and delays JAK inhibitor associated persistence.
A) Representative images showing absence of BM fibrosis in the BM of MF mice treated with vehicle, ruxolitinib, JQ1, or combo for 21 days (vehicle and JQ1) or 28 days (ruxolitinib and combo). Scale bar, 50 μM. B) Fibrosis grading of the bone marrow of MPLW515L-diseased mice treated with vehicle, JQ1, ruxolitinib, or combo (n=3/group). C) Bar graph showing the percentage of viable, GFP-positive cells in the PB and BM of MF mice treated as indicated. n=4–5 mice/condition. *p value <0.05. D) Assessment of viability (%) of SET-2 cells cultured in the presence of increasing concentrations of ruxolitinib and JQ1 alone or in combination. Arrowheads indicate an increase in the ruxolitinib concentration (1: 125 nM, 2: 150 nM). Data are representative of four independent experiments. IC, inhibitor concentration. E) Ruxolitinib-persistent cells (IC40: 125 nM) remain sensitive to treatment with JQ1. ** indicates addition of JQ1 inhibitor (IC20: 100 nM) to SET-2 cells cultured in the presence of increasing concentrations of ruxolitinib. Arrowheads indicate an increase in the concentration of ruxolitinib (1: 150 nM, 2: 200 nM, 3: 300 nM, 4: 500 nM). Data are representative of three independent experiments. F) WBC measured at week 2, 4, 6, and 8 after treatment initiation are shown. Vehicle-treated mice showed signs of morbidity after 2 weeks of treatment and were sacrificed and analyzed at this point. n= 5/treatment group. ##, data for vehicle-treated mice only available for week 2 time point. G) Serum cytokine levels of MF mice treated as indicated. Serum was collect at study endpoint (vehicle: 2 weeks, ruxolitinib and combo: 8 weeks). Color bars indicate treatment group. Hierarchical clustered heatmap shows z-scores. n=4–5/group. H) Colony formation unit (CFU) assays of CD34-positive MF cells. Each row represents the data from one patient with colony counts normalized to DMSO control wells. Combo 100 nM and Combo 250 nM indicates that cells were exposed to 100 nM or 250 nM of each drug. n=2 wells/condition is shown. Results from 5 different patients are shown. Data shown represent mean values ± S.E.M. The Student’s t-test (unpaired, two-tailed) was used to compare the mean of two groups. See also Figure S6, Tables S5 and S6.

