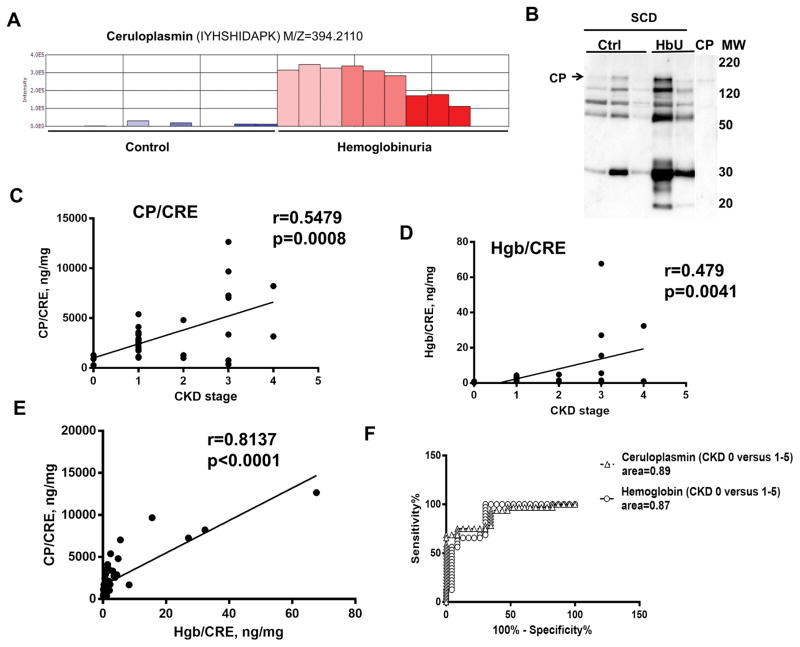
Figure 1. Ceruloplasmin (CP) in urine correlates with development of CKD in SCD patients.
(A) CP is identified by proteomic analysis of urine. Urine samples with and without hemoglobinuria (N=3 each) were selected from 20 SCD patients without proteinuria and albuminuria. SCD samples without hemoglobinuria were defined as SCD controls. Urine proteins were concentrated and desalted by centrifugation, trypsinized and analyzed by mass spectrometry. Proteins were identified by Proteome Discoverer 1.4 and quantified by SIEVE 2.1. Average intensities shown were derived from integration of ion elution profiles. (B) CP is present in urine samples. Urine samples from SCD without and with hemoglobinuria were separated by SDS PAGE and analyzed by Western blotting with antibodies against CP. Arrow indicates a position of CP. (C–D) Urine ceruloplasmin and hemoglobin correlated with stages of CKD. Correlation analysis was conducted for (C) ceruloplasmin (CP) and (D) hemoglobin (Hgb) to creatinine (CRE) ratios with stages of CKD in 34 SCD patients. Pearson correlation analysis was performed using GraphPad software in 34 SCD patients with different stages of CKD (0–5). (E) Correlation analysis of urinary hemoglobin (Hgb) and CP. CP/CRE and Hgb/CRE ratios are shown. Pearson correlation analysis was performed using GraphPad software. (F) Specificity and sensitivity of urinary ceruloplasminin SCD patients. ROC analysis of urinary CP/CRE and Hgb/CRE is shown for urine samples from SCD patients with stage 0 CKD versus stage 1–5 CKD. The analysis was performed using GraphPad software.

