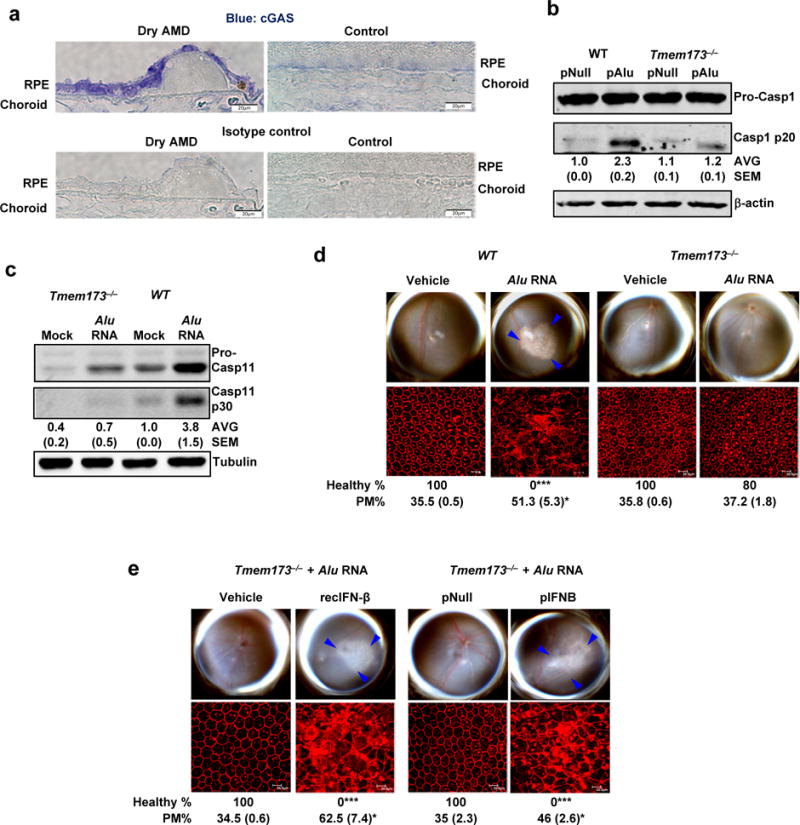
Figure 5. cGAS in geographic atrophy and RPE degeneration.

(a) Immunolocalization of cGAS in the RPE of human geographic atrophy eyes and age-matched unaffected controls. Representative image from control and Dry AMD eyes are presented, n = 4 eyes. (b) Immunoblots of pro-caspase-1 and p20 cleavage product of caspase-1 (Casp1 p20) in WT and Tmem173−/− mouse RPE cells transfected with Alu expression plasmid (pAlu) or empty vector control plasmid (pNull). (c) Immunoblots of pro-caspase-11 and p30 cleavage product of caspase-11 (Casp11 p30) in WT and Tmem173−/− mouse RPE cells mock transfected or transfected with Alu RNA. (d) Fundus photographs and immunofluorescence staining of zonula occludens-1 (ZO-1) on RPE flat mounts of WT (n = 6 eyes) and Tmem173−/− (n = 10 eyes) mice subretinally injected with vehicle or Alu RNA. (e) Fundus photographs and immunofluorescence staining of zonula occludens-1 (ZO-1) on RPE flat mounts of Tmem173−/− mice subretinally co-administered Alu RNA with recombinant IFN-β (n = 4 eyes) or vehicle control (n = 4 eyes); or IFN-β expression plasmid (pIFNB; n = 4 eyes) or empty vector control (pNull; n = 4 eyes). For all immunoblots, cropped gel image of bands of interest of representative immunoblots of three independent experiments and densitometric analysis (mean (SEM)) are shown. In d and e, binary (Healthy %) and morphometric (PM, polymegethism (mean (SEM)) quantification of RPE degeneration are shown (Fisher’s exact test for binary; two-tailed t test for morphometry; *P < 0.05; **P < 0.01; ***P < 0.001). Loss of regular hexagonal cellular boundaries in ZO-1 stained flat mounts is indicative of degenerated RPE. The degenerated retinal area is outlined by blue arrowheads in the fundus images.
