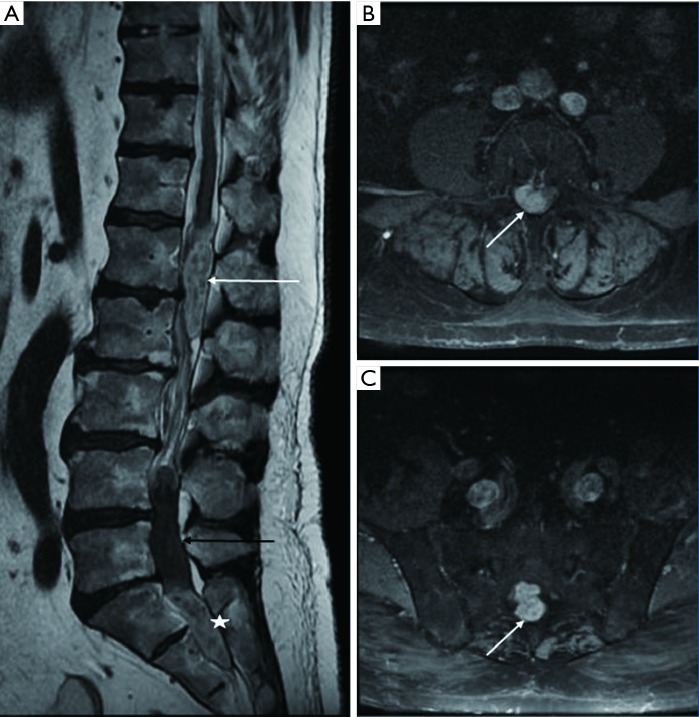
Figure 1.
Lumbosacral MRI with FAT SAT sequence. (A) Sagittal view showing two intradural extramedullary lesions well confined at lumbar level compressing cauda equina. The first one was located posteriorly to L1–L2 (white arrow), with hyper intense T2 signal. Second one was spreading from L4 to S2 (black arrow) presenting a mucoid cyst in its superior part (black arrow and B) and an inferior meaty part (star), with hyper intense T2 signal (C). Laminectomy included L1–L2 and L5–S1–S2. FAT SAT, fat saturation.

