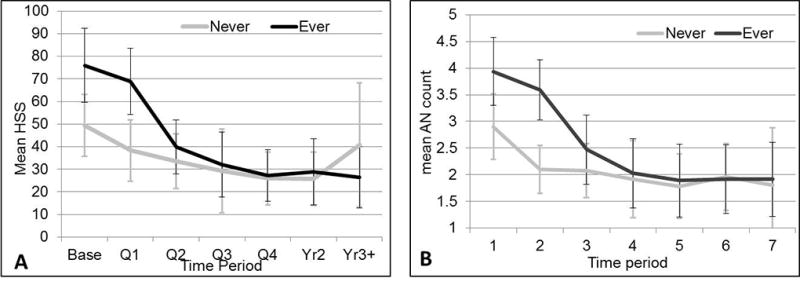
Figure 2.

A. Mean HSS by time period, stratified by ever vs never having biologics. Error bars show the 95% confidence interval. The decline from baseline was larger in patients with biologics (p=.06 at Q2, .07 at Q3, .04 at Q4, .07 at Yr2, and .01 at Yr3+). B. Mean AN count by time, stratified by biologic-ever. Error bars show the 95% confidence interval. Mean AN count declines over time more sharply in patients who ever had biologics (p=.002).
