
Figure 1. The number of rest epochs decline as KO mice age.
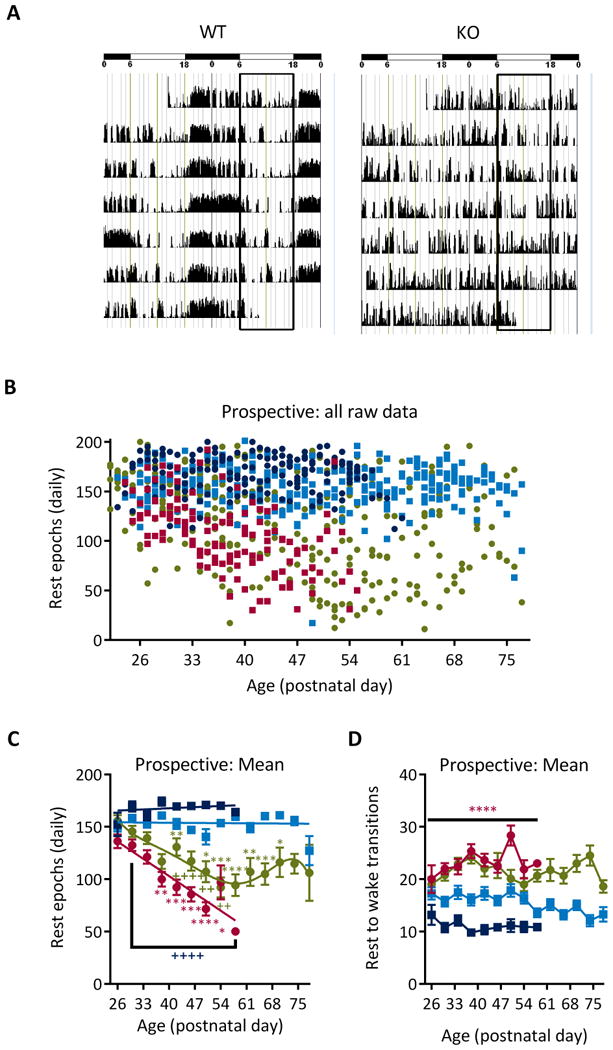
(A) Representative actograms from a WT and KO mouse over 7 days. The horizontal bars at the top indicate the light/resting phase (empty bars) and the dark/active phase (filled bars). The two vertical rectangles outline the resting phase. During each 3-min epoch, activity is scored in 0-50 units. Each epoch is plotted against time on the x-axis. (B) Scatterplot of all of the raw data. Each data point represents the total number of rest epochs for a single day for a single animal: WT (dark blue), WTKD (light blue), KO (red), KOKD (green). (C) Daily values were pooled into 4-day bins and averaged per group. Linear regression analyses indicated that both WT groups did not deviate from zero and had a minimal slope (WT: Y = -0.18*X + 161.4 and WTKD: Y = -0.03*X + 154.9), indicating that rest remained stable with age. Rest reduced with age in KO mice beginning at P38 (F(7,252)=4.99, p<0.0001) and when compared to WT (F(1,252)=365.9; p<0.0001). KD treatment of KO mice improved rest (F(3,533)=96.00; p<0.0001). Within group analyses indicates effects were not linear (F(12,536)=3.650; p<0.0001). Rest does not change among P50 and older ages in KOKD mice (F(7,140)=1.03, p=0.4). Data are expressed as the mean ± SEM; * indicates significantly differs within group from P26 value (red KO, green KOKD); + indicates statistical difference between KO (red KO × WT; green KO × KOKD); * p < 0.05, ** p < 0.01, *** p < 0.001, **** p < 0.0001. (D) The daily number of rest-active transitions were pooled for each age bin. KO mice have significantly higher rest-to-wake transitions when compared to WT controls beginning on P30 (F (3,534) = 98.6, p < 0.0001). Data are expressed as the mean ± SEM; **** p < 0.0001 indicates statistical difference compared to WT. KO mice died on P50 ± 2 days; thus n=5 KO mice from P26-46; n=3 at P50; n = 2 at P54; n=1 at P57. At all ages, WT n=5, KOKD=8 and WTKD=6. KD, ketogenic diet; KO, Kv1.1 knockout mice; WT, wild type.