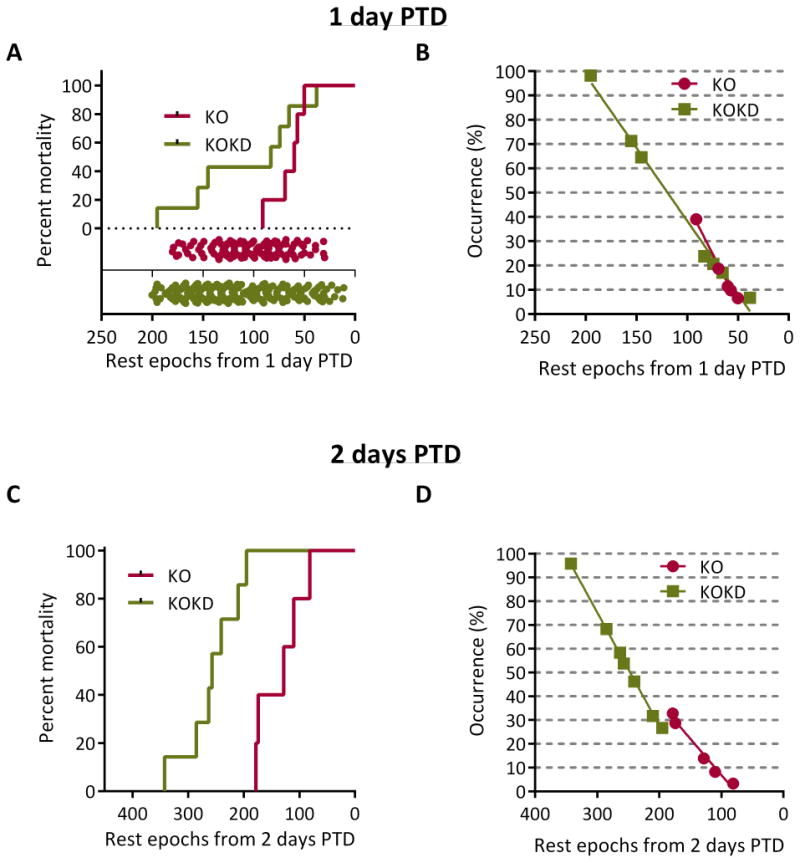
Figure 3. Acute rest epochs from 1 or 2 days PTD is not unique to the time of death.

Data analyzed for (A,B) 1 day prior to death (PTD) or (C, D) 2 days PTD. (A) The number of rest epochs from 1 day PTD was plotted against the mortality and did not differ between groups (p=0.09; Log-rank Mantel-Cox text). For KO mice, the number of rest epochs 1 day PTD was 50, 57, 60, 69 and 91. For KOKD mice, the number of rest epochs 1 day PTD was 38, 65, 74, 83, 145, 155 and 195 rest epochs. The range of the raw data (i.e. the number of rest epochs for each animal for each day) shown in the scatterplot superimposed on the lower portion of the percent mortality graph (red for KO and green for KOKD). (B) The occurrence rate for the daily rest epoch value at 1 day PTD was calculated to determine how often that amount of rest or less occurred throughout the lifespan of that animal or any other animal within the same group. (C) The number of rest epochs that occurred during 2 days PTD were summed and plotted against the mortality (p<0.0005, Log-rank Mantel-Cox test). (D) The occurrence rate for the daily rest epoch value during 2 days PTD was calculated to determine how often that amount of rest or less occurred throughout the lifespan of that animal or any other animal within the same group (ranges for KO: 3–33% and KOKD: 27–96%).
