
Figure 6. Chronic accumulation of rest deficiency over the final 15 days PTD is sensitive to the timing of death for 75% of subjects.
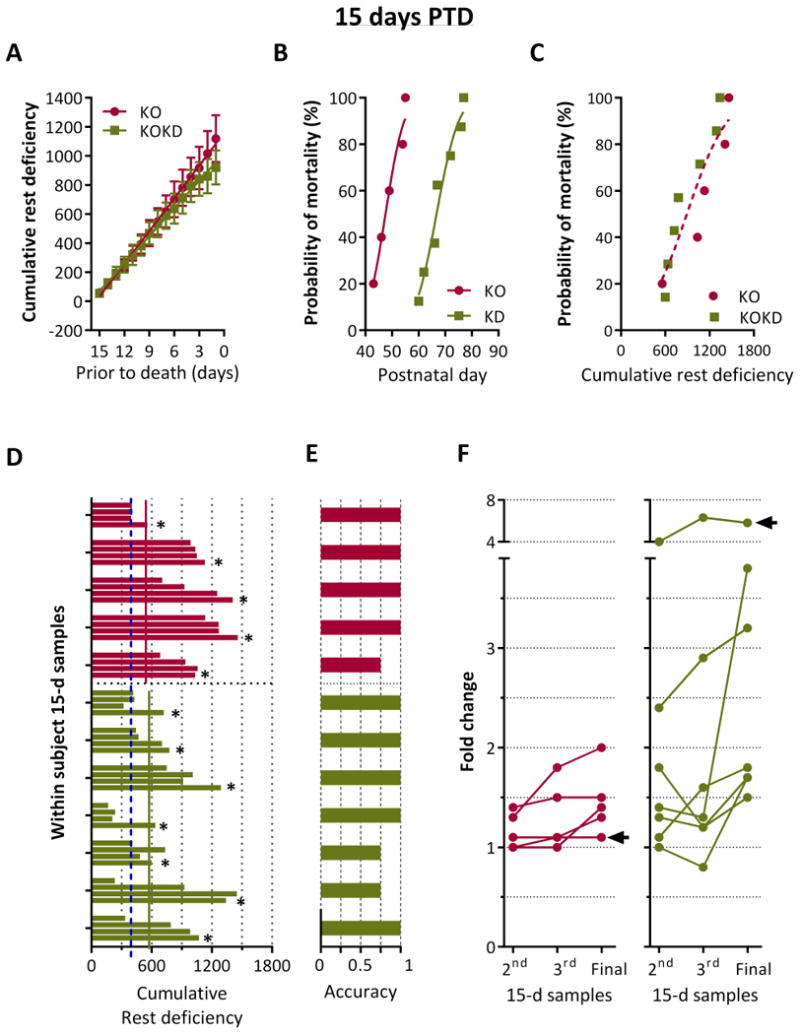
(A) Cumulative probability of rest deficiency (in epochs) significantly correlated with days prior to sudden death (PTD) for KO (R2 0.99, p < 0.0001) and KOKD groups (R2 0.99, p < 0.0001; Pearson's correlation). Linear regression indicates no statistical difference between slopes (F (1,176) = 2.5, p = 0.12) or y-intercept (F (1, 177) = 2.0, p = 0.16). Data are expressed as the mean ± SEM. (B) Cumulative probability of mortality as a function of age for KO and KOKD groups (the histogram of the frequency distribution was analyzed using a cumulative Gaussian nonlinear fit; p < 0.0001). (C) Cumulative probability of mortality as a function of cumulative rest deficiency. Gaussian nonlinear regression analysis fits both data set with a single curve (R2 = 0.91 for KO and 0.93 for KOKD). (D) Samples of accumulated deficiency in rest over 15 days were taken at four time points. Deficiency over the first 15 days is represented as the first bar of the 4 bar clusters and the final 15 days is the last bar (denoted by the asterisks). KO mice are in red and KOKD mice are in green. The blue dashed line depicts the lowest amount of rest deficiency experienced by KO mice. The horizontal lines indicate the least amount of deficiency at 15 days PTD for KO (red) and KOKD (green) groups. (E) Fractional depiction of whether the highest amount of rest deficiency was accurately associated with death when considering the ranking of within subject samples from highest to lowest deficiency in rest. (F) The fold change in rest deficiency compared the 2nd, 3rd and final 15-day samples to the first 15-day sample. The first sample began at data acquisition and was considered baseline. The final sample was 15 days PTD. Arrow indicates a subject in which the ratio of rest deficiency was not increased during the Final 15-days PTD.