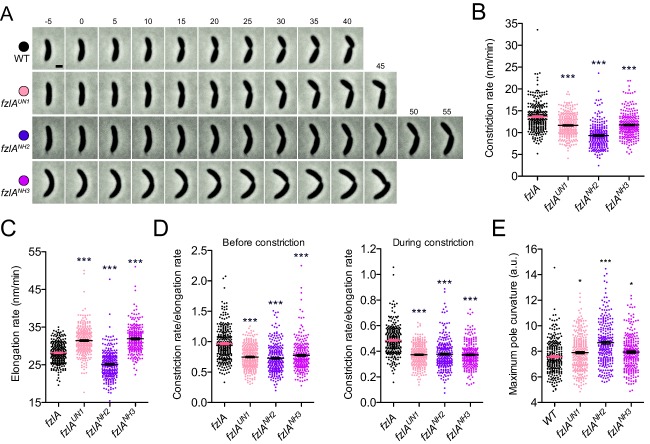
Figure 6.

fzlA mutant strains show protracted constriction.
A. Phase contrast images of representative constricting cells from fzlA allelic exchange strains, acquired at 5‐min intervals. For each strain, constriction begins in the second frame (t = 0) and ends on cell separation in the last frame. Scale bar = 1 μm.
B, C. Plots of constriction rate (B) and elongation rate during constriction (C) for a population of synchronized cells from each fzlA strain, calculated from single cell microscopy data. Mean ± SEM is shown. One‐way ANOVA tests with Tukey's multiple comparison test were performed to analyze differences compared to WT: *** P ≤ 0.001. From left to right, n = 271, 295, 260, 249 (B) and 266, 293, 258, 246 (C).
D. Plots of the ratio of constriction rate to elongation rate before constriction (left) and during constriction (right) for a population of synchronized cells from each fzlA strain, calculated from single cell microscopy data. Mean ± SEM is shown. One way ANOVA tests with Tukey's multiple comparison test were performed to analyze differences compared to WT: *** P ≤ 0.001. From left to right, n = 271, 295, 260, 249 (left) and 266, 293, 258, 246 (right).
E. Plot of the maximum curvature of the poles for a synchronized population of single cells for each fzlA allelic exchange strain. Mean ± SEM is shown. A one‐way ANOVA with a Kruskal‐Wallis test was performed to analyze differences compared to WT: * P ≤ 0.05, *** P ≤ 0.001. From left to right, n = 261, 288, 249, 245. Strain key: WT (NA1000), fzlAUN1 (EG1908), fzlANH2 (EG1600), fzlANH3 (EG1909).
