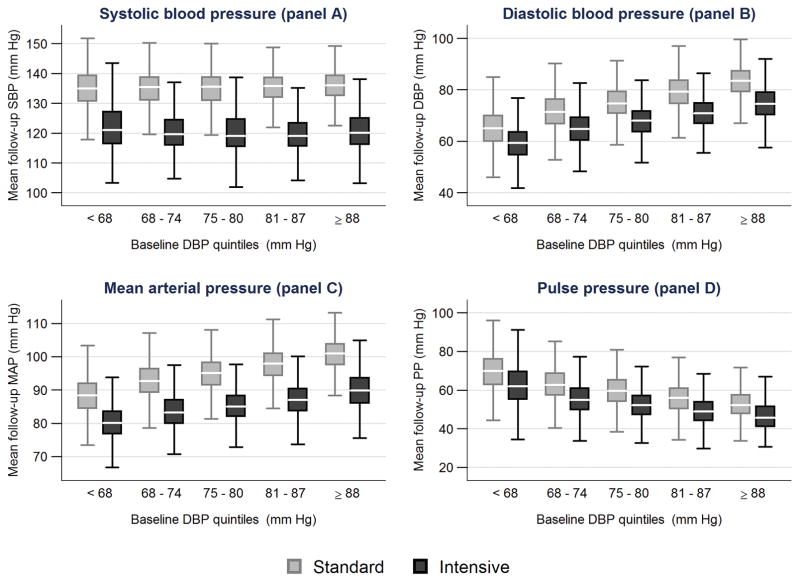
Figure 1.
The boxplots display the median, 25th and 75th percentiles of the patients’ mean follow-up values for systolic blood pressure (panel A), diastolic blood pressure (panel B), mean arterial pressure (panel C) and pulse pressure (panel D), by randomized SBP intervention and quintile of baseline DBP (N=9119). 242 of 9361 subjects (2.6%) (140 in the standard group and 102 in the intensive group) had missing blood pressure measurements after month 2 and are not included.
SBP = systolic blood pressure; DBP = diastolic blood pressure.

