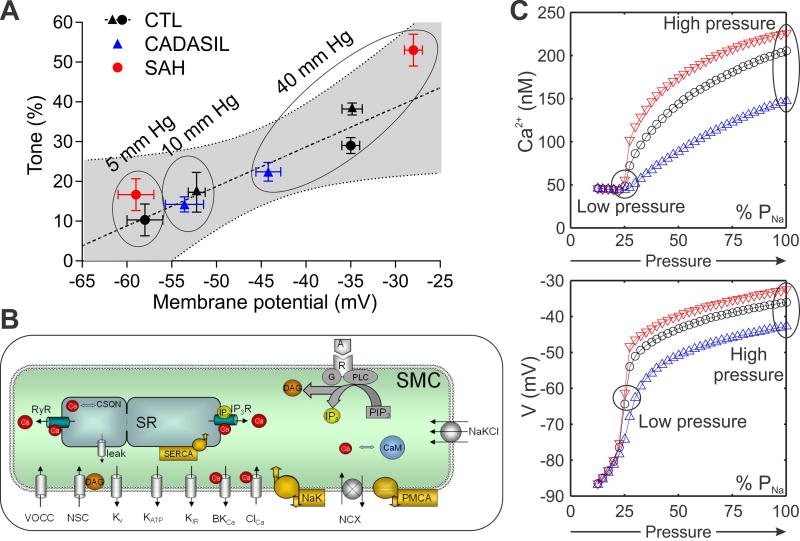
Figure 3. Relationship between myogenic tone and membrane potential.
(A) Values of membrane potential and myogenic tone at different intravascular pressure (mm Hg) from CADASIL (TgNotch3R169C, blue triangles) and SAH (red circles) animals are consistent with the linear regression obtained from CTL animals (black triangles represent CTL mice from (17) and black circles represent CTL rats from (6)) showing a similar relationship between tone and membrane potential. (B) A detailed model of SMC membrane potential and Ca2+ dynamics was adapted from (102) and modified by incorporating the KV1 current of PA SMCs from CTL animals (Figure 2), while adjusting other transmembrane currents (KIR, NSC, VDCC, NaK, PMCA) to produce resting Vm and Ca2+ concentration in agreement with experimental data (17,103). The effect of altered KV1 channel density in CADASIL (blue triangles) and SAH (red triangles) was examined assuming all other model parameters remain the same as in CTL (black circles). (C) The effect of increasing pressure was simulated by depolarizing SMC membrane through increasing Na+ permeability (PNa). Model simulations, in agreement with the corresponding experiments in (A), show differences between CADASIL and SAH animals in Vm (bottom) and Ca2+ (top) as pressure increases and highlight the inhibitory role of KV channels and the effect KV channel density on myogenic tone. Parameters as in reference (102) except: PVDCC=6.3×10⁻⁵ cm/s; PNaNSC=1.23×10⁻⁶ cm/s; IPMCA=8.58 pA; INaK=7.76 pA/pF; GKIR = 0.5 nS/(mM)0.5; GNa,leak=0.12 nS; Cm = 12.8 pF.

