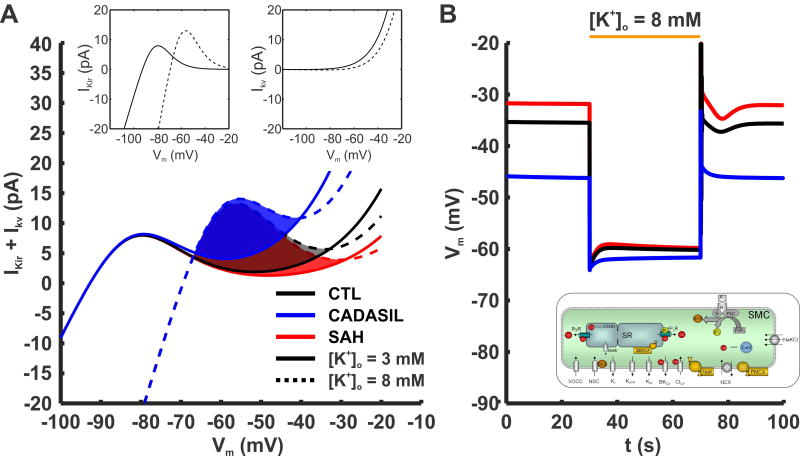
Figure 4. Effect of PA SMC KV current density and the interplay with KIR current on Vm dynamics at rest and during potassium challenge.
(A) Combined contribution of KIR and Kv currents in healthy and diseased models during rest and [K+]o stimulus. Activation of KIR current by [K+]o and hyperpolarization is accounted: where Gkir,max is the maximal KIR conductance. Solid lines show the sum of the two currents at rest, and dashed lines are during elevation of [K+]o from 3 to 8 mM. The shaded regions show the range of voltages within which KIR current increases more than KV current decreases during the K+ stimulus, i.e. the resting Vm window where the K+ challenge will result in hyperpolarization. As KV current density increases (from SAH, red lines; to CTL black lines; to CADASIL, blue lines) the window shrinks in size and shifts to more hyperpolarized potentials. (B) Representative simulation using the model of PA SMCs from Figure 3. SMCs from CTL (black line), CADASIL (blue line) and SAH (red line) conditions hyperpolarize following an increase in extracellular K+, [K+]o, from 3 mM to 8 mM. The change in membrane potential is less for CADASIL as a result of the more hyperpolarized resting Vm prior to the K+ challenge. GKIR = 0.76 [nS/(mM)0.5]; kKIR = 7 [mV]; VKIR,0.5= EK+12 [mV].

