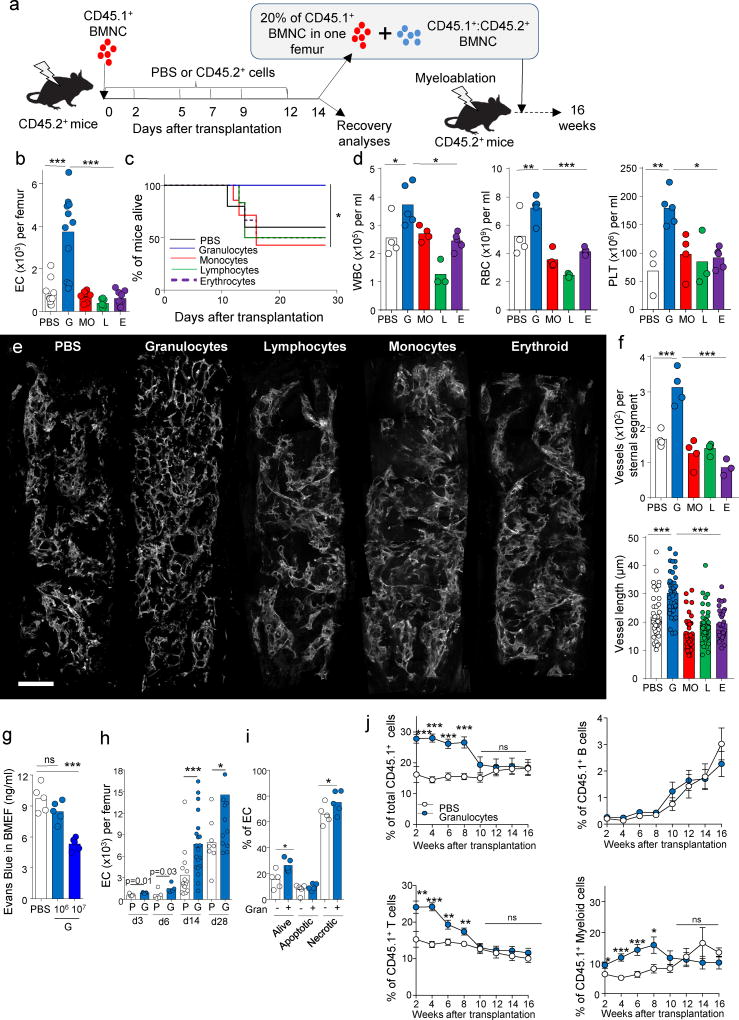
Figure 2. Granulocytes promote vascular regeneration.
(a) Experimental design, CD45.2+ recipients were lethally irradiated, followed by transplant of CD45.1+ bone marrow nucleated cells (BMNC), and treatment with PBS or FACS-purified BM mature cells at the indicated time points. Mice were euthanized two weeks after the initial transplant and the BM and peripheral blood analyzed for regeneration. In some cases the CD45.1+ cells were FASC purified, mixed with BMNC from CD45.1+:CD45.2+ mice and transplanted into lethally irradiated CD45.2+ secondary recipients. (b) The number of endothelial cells (EC, CD45−Ter119−CD31+CD105+) in the femur of C57BL/6 mice 14 days after lethal irradiation and transplantation of 105 CD45.1+ BMNCs, followed by adoptive transfer of all of the granulocytes (G: Gr1+CD115−, 1×10⁶), monocytes and macrophages (MO: CD115+ or F4/80+ cells pooled together cells within the Gr1−CD4−CD8−B220− gate, 1×10⁵), lymphocytes (L: CD4+, CD8+ and B220+ cells pooled together , 7.5×10⁵) and erythroid (E: Ter119+, 1×10⁵) cells found in 2×10⁶ CD45.2+ BMNCs (PBS n=11, G n=11, MO n=9, L n=8, E n=9). p-values were calculated using 1-way ANOVA model. (c,d) Survival curves (c, PBS n=5, G n=6, MO n=7, L n=6, E n=6) and peripheral blood recovery (d, PBS n=4, G n=5, MO n=4, L n=3, E n=5) for mice treated as in b; each circle represents one mouse. p-values were calculated using Log Rank analyses or one-way ANOVA. (e) A representative composite image showing blood vessels (white, CD31/CD144) in sternal segments purified from PBS-, G-, L-, MO- or E-treated mice 14 days after lethal irradiation and transplantation. Images are representative of four mice for each group in two different experiments. Scale bar 200µm. (f) Quantification of intact blood vessel segments (top, each circle represents one mouse; PBS: n=4, G: n=4, MO: n=4, L: n=4, E: n=3,) or average vessel length (bottom, each circle represents one vessel, PBS n=41, G n=40, MO n=40, L n=40, E n=30) in the sternum of the mice shown in e. p-values were calculated using one-way ANOVA. (g) Quantification of extravasation of Evans Blue dye in the BM extracellular fluid of transplanted mice treated with PBS (n=5) or serial adoptive transfer of 106 (n=5) or 107 granulocytes (n=5) 14 days after the initial transplant. p-values were calculated using one-way ANOVA. (h) Kinetics of endothelial cell recovery in PBS (P: D3 n=5, D6 n=5, D14 n=15, D28 n=8) or granulocyte (G: D3 n=5, D6 n=5, D14 n=20, D28 n=13) treated mice at the indicated time points. Each circle represents one mouse. p-values were calculated using two tailed, Two-sample, T-test. (i) Frequency of live, apoptotic and necrotic endothelial cells, determined using DAPI stain for live/death discrimination and caspase 3 staining to detect apoptotic and necrotic cells , in the BM of mice treated with PBS (n=5) or granulocytes (n=5) 6 days after transplantation. Each circle represents one mouse. p-values were calculated using two tailed, Two-sample, T-test. (j) CD45.1+ cell engraftment in total, B, T or myeloid cells in secondary recipients at the indicated time points after transplantation of 2.5×10⁵ CD45.1+:CD45.2+ competitor BMNCs and 20% CD45.1+ cells obtained from one femur of granulocyte- or PBS-treated primary recipient mice 14 days after the primary transplant. PBS, n=18 for weeks 2–8, n=13 for weeks 10–16; Granulocytes n=17 for weeks 2–8, n=12 for weeks 10–16. p-values were calculated using two tailed, Two-sample, T-test. Dots indicate the mean and error bars the SEM. In all other panels the bar graphs represent the mean and show the pooled data of at least two independent experiments. *P<0.05, **P<0.01, ***P<0.001, n.s., not significant.

