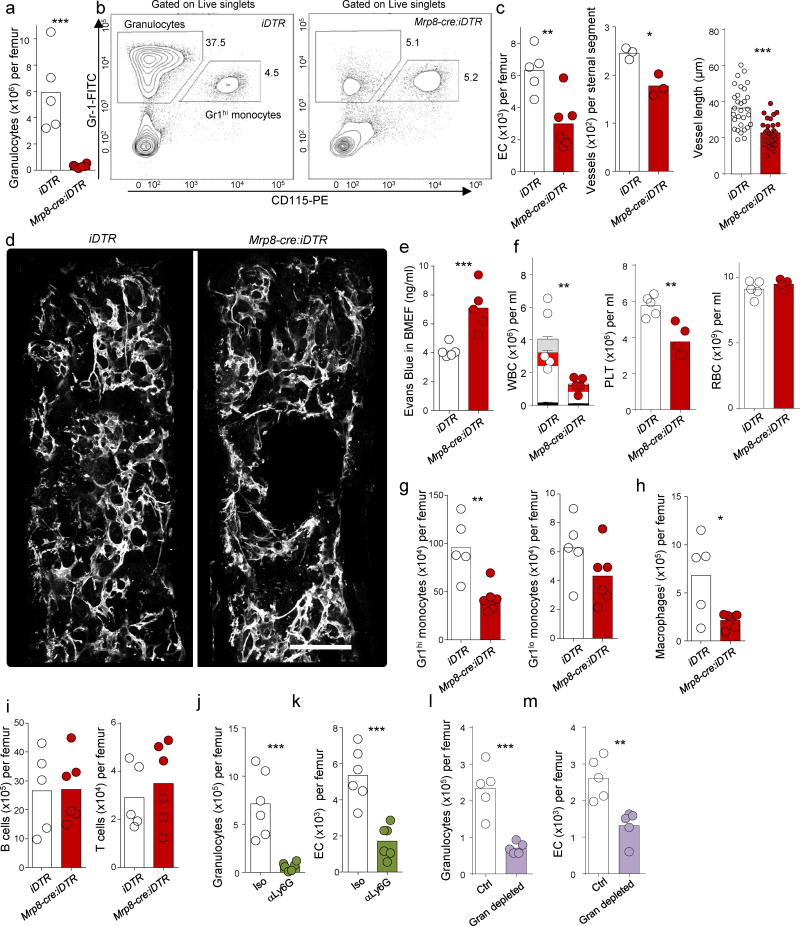
Figure 3. Granulocytes are necessary for vascular regeneration.
(a, b) Quantification of the number of Gr1+CD115− granulocytes (a) and representative FACS plots (b) in lethally irradiated C57BL6/J mice 14 days after transplantation of 5×10⁶ iDTR (n=5 mice) or Mrp8-cre:iDTR (n=6 mice) BMNCs, followed by diphtheria toxin treatment. FACS plots are representative of two experiments. (c) The number of endothelial cells (EC, CD45−Ter119−CD31+CD105+) in the femur (iDTR: n=5 mice, Mrp8-Cre:iDTR: n=6 mice) and the number (iDTR: n=3 mice, Mrp8-Cre:iDTR: n=3 mice) and length (iDTR: n=30 vessels from 3 mice, Mrp8-Cre:iDTR: n=30 vessels from 3 mice) of vessels in the sternum of the mice analyzed in a. (d) A representative composite image showing blood vessels (white, CD31/CD144) in sternal segments of C57BL/6J mice treated as in a. Images are representative of 3 mice per group in two different experiments. Scale bar 200µm. (e) Quantification of extravasation of Evans Blue dye in the BM extracellular fluid of mice treated as in a (iDTR: n=5, Mrp8-Cre:iDTR: n=5). (f) Number of white blood cells (each circle represents one mouse) and frequency of T cells (black bar), B cells (white bar), monocytes (red bar) and neutrophils (grey bar) (left); platelets (middle) and red blood cells (right) in the peripheral blood of mice treated as in a. (iDTR: n=5, Mrp8-Cre:iDTR: n=5). (g-i) Numbers of monocytes (g), macrophages (h), and lymphocytes (i) in the BM of the mice treated as in a. (iDTR: n=5, Mrp8-Cre:iDTR: n=6) (j,k) Numbers of Ly6G+ granulocytes (j) and endothelial cells (k) in the BM of lethally irradiated C57BL6/J mice 6 days after transplantation of 106 BMNC and treatment with isotype control (Iso; n=6) or αLy6G antibodies (n=6). (l,m) Numbers of granulocytes (l) and endothelial cells (m) in the BM of lethally irradiated C57BL6/J mice 6 days after transplantation of 106 BMNC (Ctrl: n=5) or a graft of 0.5×10⁶ BMNCs containing all other hematopoietic cells found in 106 BMNC but in which granulocytes had been removed via FACS (Gran depleted: n=5). For all panels p-values were calculated using two tailed, Two-sample, T-test and the graphs show the pooled data of at least two independent experiments. Bar graphs represent the mean and error bars represent standard error. *P<0.05, **P<0.01, ***P<0.001, n.s., not significant.

