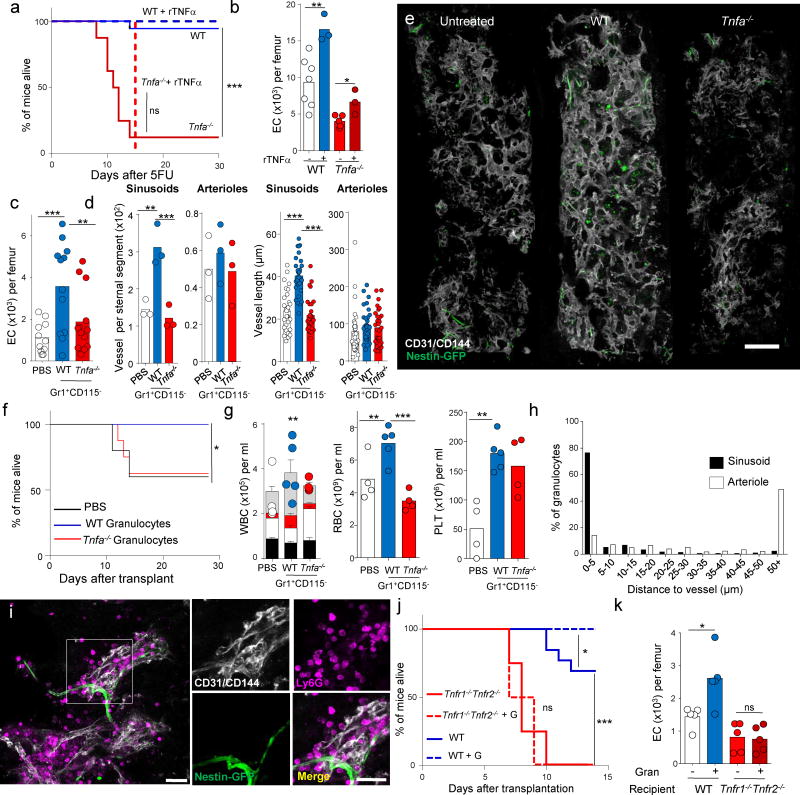
Figure 4. Granulocytes promote vascular regeneration via TNFα.
(a) Survival curves for WT and Tnfa−/− mice after injection of 250mg/kg body weight of 5-fluorouracil (5FU) and treatment with either PBS (WT n=18, Tnfa−/− n=16) or recombinant TNFα (WT n=7, Tnfa−/− n=4). p-values were calculated using Log Rank analyses. (b) Number of endothelial cells in the femur of C57BL/6 mice treated as in a, 8 days after 5FU injection. (WT-r TNFα: n=7, WT+rTNFα: n=3, Tnfa−/−-rTNFα: n=5, Tnfa−/−+rTNFα: n=3). p-values were calculated using two tailed, Two-sample T-test. (c) Number of endothelial cells in the femurs of Nestin-gfp mice 14 days after lethal irradiation and transplantation of 105 CD45.1+ BMNCs, followed by treatment with PBS (n=11) or adoptive transfer of Gr1+CD115+ granulocytes from WT (n=12) or Tnfa−/− (n=13) mice. p-values were calculated using 1-way ANOVA model. (d) Quantification of the number (each circle represents one mouse. PBS: n=3, WT: n=3, Tnfa−/−: n=3) and length (each circle represents one vessel, PBS: n=90, WT: n=90 and Tnfa−/−: n=90 vessels from 3 mice) of intact sinusoidal and arterial segments in the sternum of the mice shown in c. p-values were calculated using 1-way ANOVA model. (e) A representative composite image showing blood vessels (white, CD31/CD144) in sternal segments of Nestin-gfp mice treated with PBS (untreated), WT or Tnfa−/− granulocytes. Images are representative of at least 5 mice per group in four different experiments Scale bar=200µm (f) Survival curves for the mice treated as in c (PBS n=5, WT n=6, Tnfa−/− n=8). (g) Number of white blood cells (each circle represents one mouse) and frequency of T cells (black bar), B cells (white bar), monocytes (red bar) and neutrophils (grey bar) (left); platelets (middle) and red blood cells (right) in the peripheral blood of mice treated as in c. (PBS: n=4, WT: n=5, Tnfa−/−: n=4). p-values were calculated using 1-way ANOVA model. (h) Percentage of granulocytes (n=305 granulocytes in two mice) found at the indicated distances from sinusoids (black) or arterioles (white) in Nestin-gfp mice 6 days after lethal irradiation and transplantation of 106 BMNCs. Bar graphs represent the pooled data of two mice in two independent experiments. (i) Immunofluorescence analyses showing the association between transferred granulocytes (magenta, Ly6G) with regenerating sinusoids (white, CD31/CD144) and arterioles (white and green, CD31/CD144+Nestin-GFPbright) in the mice shown in h. Scale bar=25µm. Images are representative from 2 mice in two independent experiments. (j) Survival curves for WT and Tnfr1−/−:Tnfr2−/− mice after lethal irradiation and transplantation of 105 CD45.1+ BMNCs, followed by treatment with PBS (WT n=13, Tnfr1−/−:Tnfr2−/− n=4) or adoptive transfer of WT granulocytes (WT n=12, Tnfr1−/−:Tnfr2−/− n=6). p-values were calculated using Log Rank analyses. (k) Number of endothelial cells in mice treated as in j but 6 days after the initial transplant. (WT+PBS: n=5, WT+Gran: n=5, Tnfr1−/−:Tnfr2−/−+PBS: n=5, Tnfr1−/−:Tnfr2−/−+Gran: n=5). p-values were calculated using 1-way ANOVA model. In all panels (with the exception of h) the graphs show the pooled data of at least two independent experiments and bar graphs represent the mean. Error bars represent the standard error. *P<0.05, **P<0.01, ***P<0.001, n.s., not significant.

