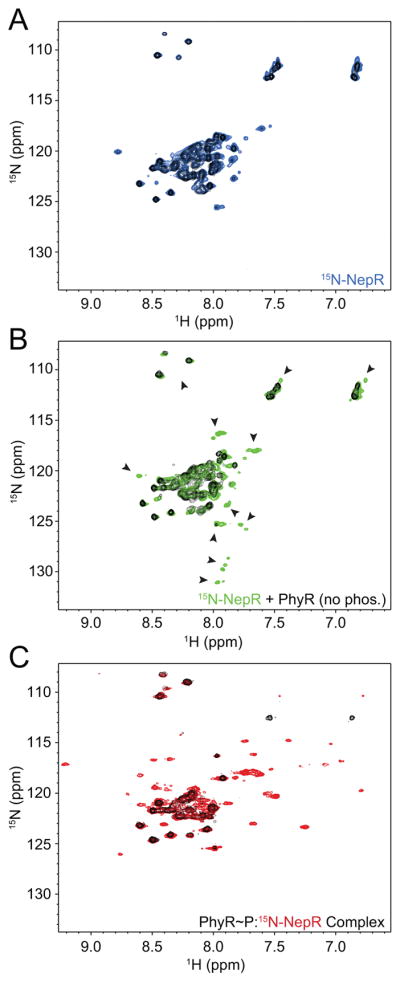
Figure 5. NepR interaction with unphosphorylated PhyR affects NepR structure.

1H-15N HSQC spectra of uniformly 15N-labeled C. crescentus NepR; CLEANX-PM spectra for all samples are shown in black. (A) NepR alone (blue); (B) NepR in the presence of excess unlabelled, unphosphorylated C. crescentus PhyR (green, arrows indicate new, shifting, or lost peaks); (C) NepR in a complex with unlabeled PhyR~P, denoted PhyR~P:15N-NepR (red).
