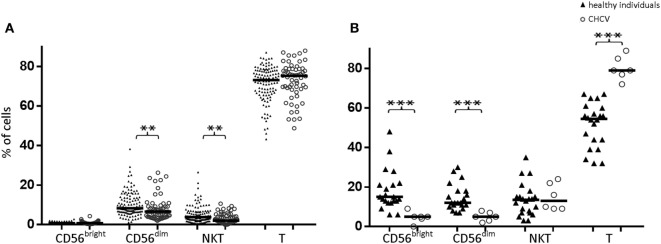
Figure 2.
(A) Comparison of CD56bright, CD56dim, NKT (CD3+CD56+), and T lymphocyte subpopulations in peripheral blood between healthy individuals and chronic HCV (CHCV) patients. (B) Comparison of liver cell subpopulations between healthy individuals and CHCV patients. The results are expressed as percentages of positive cells within each subpopulation. Black lines indicate median expression. **p < 0.01, ***p < 0.001, Mann–Whitney U test.

