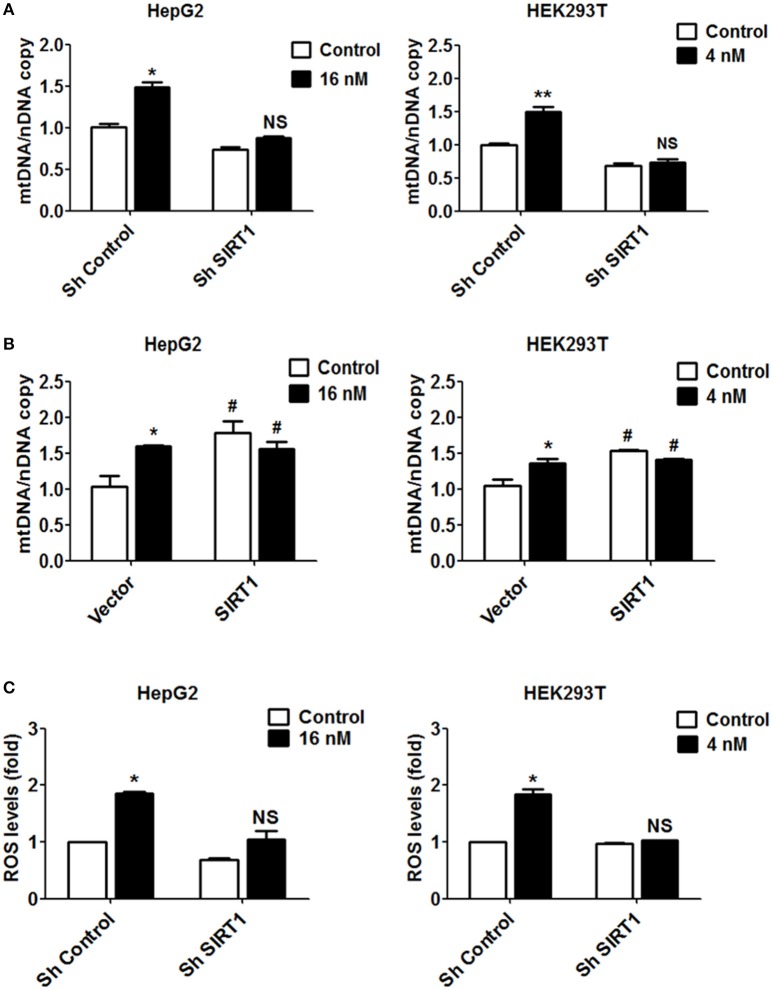
Figure 5.
Increased mitochondrial biogenesis and ROS production in response to T-2 toxin treatment require SIRT1. (A) Mitochondrial DNA content analyzed in HepG2 and HEK293T cells with/without knockdown of SIRT1 exposed to T-2 toxin. Left, copies of mitochondrial DNA in HepG2 cells; Right, copies of mitochondrial DNA in HEK293T cells. (B) HepG2 and HEK293T cells overexpressing SIRT1 were treated with T-2 toxin, and the mitochondrial DNA content was determined using RT-qPCR. Left, copies of mitochondrial DNA in HepG2 cells; Right, copies of mitochondrial DNA in HEK293T cells. (C) ROS production in HepG2 and HEK293T cells infected with SIRT1 or nontargeting shRNA after T-2 toxin exposure was tested by a flow cytometry assay after staining with carboxy-H2DCFDA. Left, ROS levels measured in HepG2 cells; Right, ROS levels measured in HEK293T cells. *P < 0.05 and **P < 0.01 for comparison between the control and T-2 toxin-treated groups. #P < 0.05 for comparison between the SIRT1 or SIRT1+T-2 toxin group and the control group, respectively.

