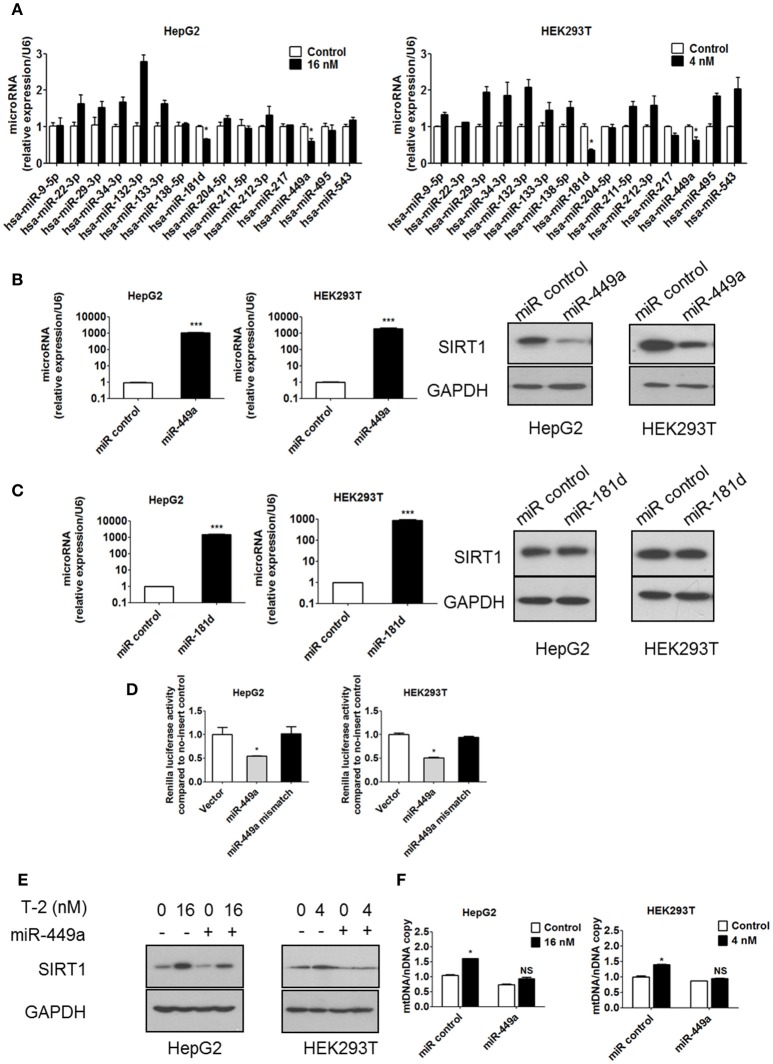
Figure 6.
T-2 toxin enhances protein level of SIRT1 through miR-449a. (A) miRNA expression in T-2 toxin-treated cells. Top, miRNA levels in HepG2 cells analyzed by RT-qPCR; Bottom, miRNA levels in HEK293T cells analyzed by RT-qPCR. (B) The expression levels of miR-449a in HepG2 and HEK293T cells transfected with miR-449a mimics was detected by RT-qPCR. The protein level of SIRT1 in HepG2 and HEK293T cells transfected with miR-449a mimics was analyzed. Left, SIRT1 protein level in HepG2 cells; right, SIRT1 protein level in HEK293T cells. (C) The expression level of miR-181d in HepG2 and HEK293T cells transfected with miR-181d mimics was detected by RT-qPCR. The SIRT1 expression level in HepG2 and HEK293T cells transfected with miR-181d mimics was analyzed by western blotting. Left, SIRT1 protein level in HepG2 cells; Right, SIRT1 protein level in HEK293T cells. (D) Luciferase reporter assays were performed in HepG2 and HEK293T cells transfected with either the control pmirGLO vector or pmirGLO containing the SIRT1 3′UTR target sequence of miR-449a (both wild type and mutant), in the presence of miR-449a mimics. (E) The protein level of SIRT1 in HepG2 and HEK293T cells transfected with miR-449a mimics and treated with T-2 toxin was analyzed. (F) The mitochondrial DNA content in HepG2 and HEK293T cells transfected with miR-449a mimics and treated with T-2 toxin was analyzed. Statistically significant differences are indicated by asterisks (*P < 0.05, ***P < 0.001).

