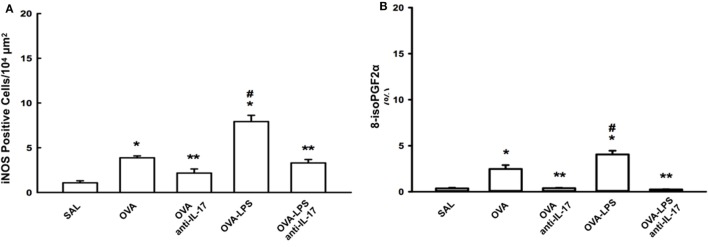
Figure 6.
Effects of anti-IL-17 on oxidative stress. (A,B). (A) iNOS-positive cells and (B) the 8-iso-PGF2α volume fraction. The results are expressed as positive cells/104 µm2, and the volume fraction is expressed as percentages of area (%). Data are presented as the means ± SEs. The differences were considered significant when p < 0.05 (*p < 0.05 vs. SAL group; **p < 0.05 vs. OVA and OVA-LPS groups; #p < 0.05 vs. OVA group).

