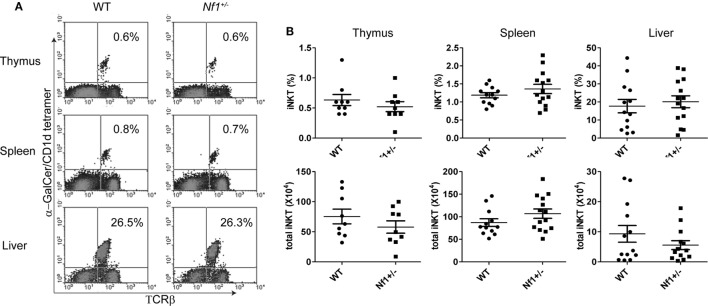
Figure 2.
Comparable numbers of iNKT cells in wildtype (WT) and Nf1+/− mice. (A) Thymocytes, splenocytes, and liver mononuclear cells from Nf1+/− mice and WT littermates were stained with α-GalCer-loaded CD1d tetramers and a TCR-β-specific antibody for the identification of iNKT cells, identified in the upper right quadrant. (B) Percentages (upper) and total numbers (lower) of iNKT cells are summarized for the thymus, spleen and liver. Pooled data from three independent experiments are shown. Each dot represents an individual mouse. The data are plotted as mean ± SEM.

