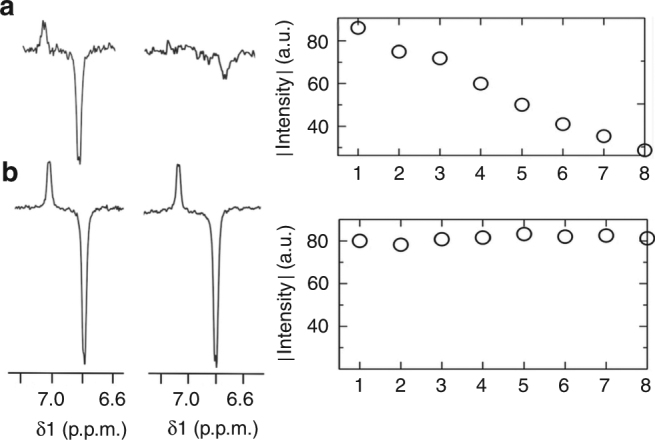
Fig. 4.

Photo-CIDNP of AcTyr under continuous illumination. a Array of eight consecutive (not on-flow) experiments (28 scans each). Continuous irradiation of the active volume during the whole experiment causes flavin photodegradation. Left of panel: spectra corresponding to the first (1st) and last (8th) experiments showing the impact of degraded flavin on the AcTyr CIDNP signal. Right of panel: Plot of the AcTyr CIDNP signal intensity of the eight consecutive experiments. The increasing signal decay occurs due to gradual accumulation of degraded flavin within the detection volume. b Array of eight consecutive on-flow experiments (28 scans each) under continuous illumination. Left of panel: spectra corresponding to the first (1st) and last (8th) experiments showing the benefits of pumping fresh sample on the AcTyr CIDNP signal. Right of panel: Plot of the CIDNP AcTyr signal intensity at the end of each of the eight consecutive experiments. The AcTyr CIDNP signal does not decrease over the course of the experiment since degraded flavin is continuously replaced by fresh sample. Both experiments were performed with the same acquisition parameters and experimental conditions using 5 mM AcTyr and 1 mM FMN in 100% D2O
