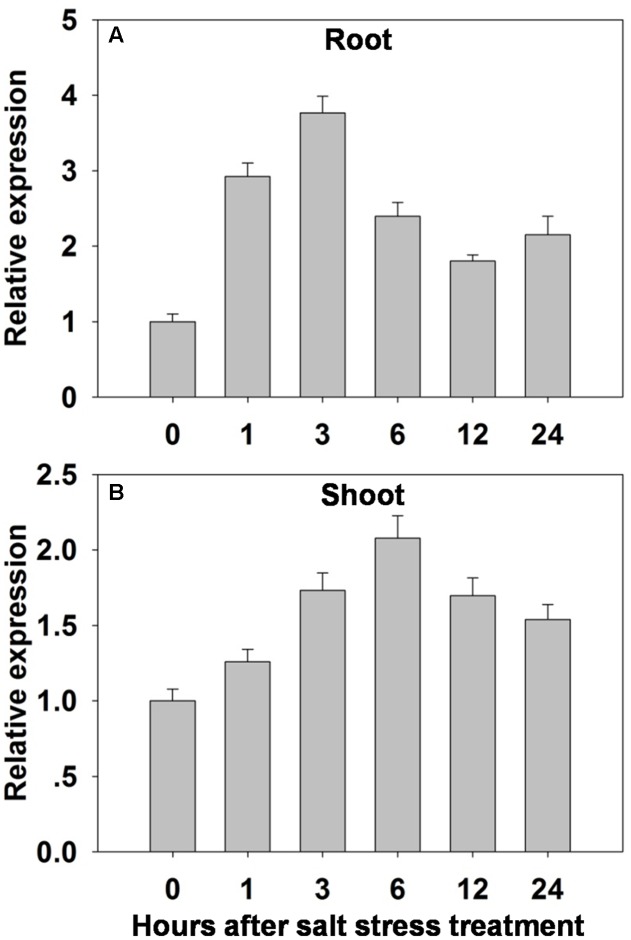
FIGURE 3.
The effect of salinity stress (100 mM NaCl for 0–24 h) on the transcription of OsHAK1 in (A) the roots and (B) the shoots of WT seedlings. Transcript abundances were derived using qRT-PCR, with Ubq chosen as the reference sequence. The abundance of OsHAK1 transcript prior to the salinity treatment was set arbitrarily as 1. The whiskers indicate the SE (n = 3).

