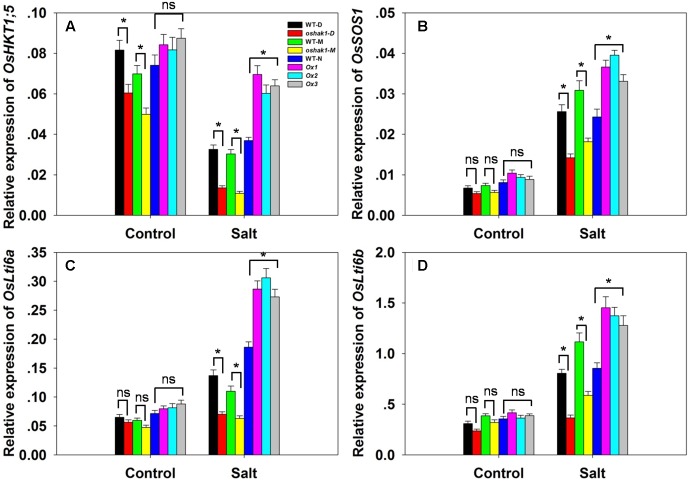
FIGURE 7.
The abundance of transcript from genes encoding Na+ transporters. (A–D) The transcription in the roots of hydroponically-grown seedlings raised either in the presence or absence of salinity stress: (A) OsHKT1;5, (B) OsSOS1, (C) OsLti6a, (D) OsLti6b. Outputs derived from qRT-PCRs were normalized against the abundance of Ubq transcript. Values shown in the form mean ± SE (n = 3). Significant differences (P < 0.05) between the test genotype and WT are indicated by an asterisk. ns, non-significant difference.

