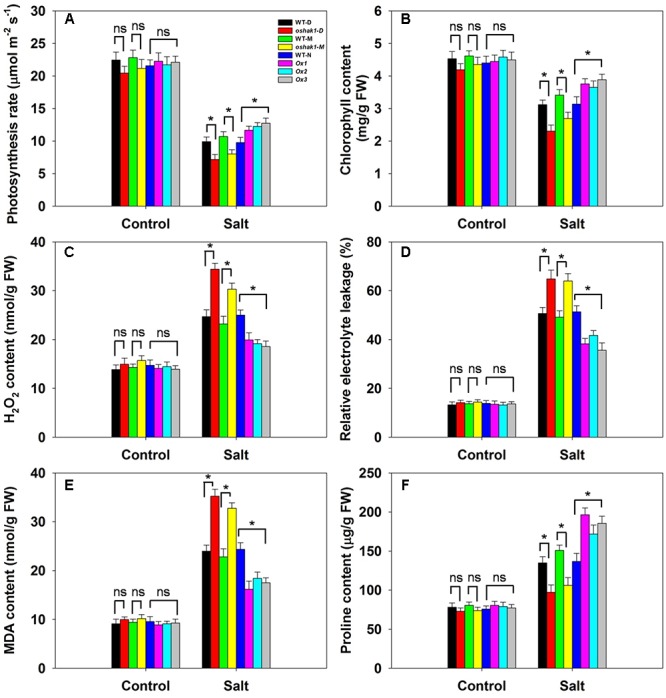
FIGURE 8.

The effect of OsHAK1 on the physiology of soil-grown plants exposed to salinity stress. (A) Photosynthetic rate, (B) leaf chlorophyll content, (C) H2O2 content, (D) relative electrolyte leakage, (E) MDA content and (F) proline content. Values shown in the form mean ± SE (n = 5). Significant differences (P < 0.05) between the test genotype and WT are indicated by an asterisk. ns, non-significant; FW, fresh weight.
