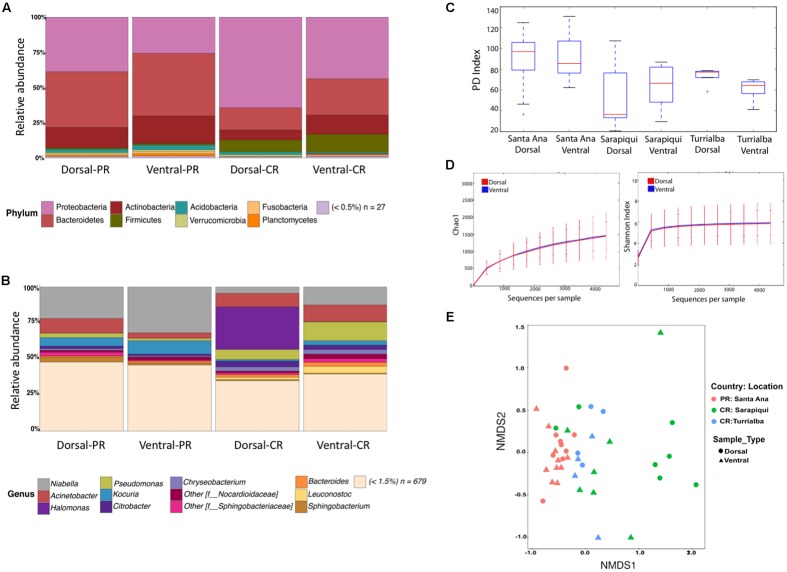
FIGURE 1.
Microbiota diversity in dorsal and ventral swab samples among toads in Puerto Rico and Costa Rica. (A) Taxonomic bar plots showing bacterial phyla among ventral and dorsal samples. (B) Taxonomic bar plots at the genus level. (C) Faith’s phylogenetic diversity (PD) boxplots overall dorsal and ventral swabs per location. (D) Rarefaction plots of Chao1 (t-test, t-stat = –0.072, p-value = 0.94) and Shannon (t-test, t-stat = 0.164, p-value = 0.868) between dorsal and ventral skin sites. (E) Non-metric multidimensional scaling (NMDS) plots of samples according to location and sample type (stress = 0.15 and PERMANOVA Pseudo-F: 0.965, p-value = 0.461).

