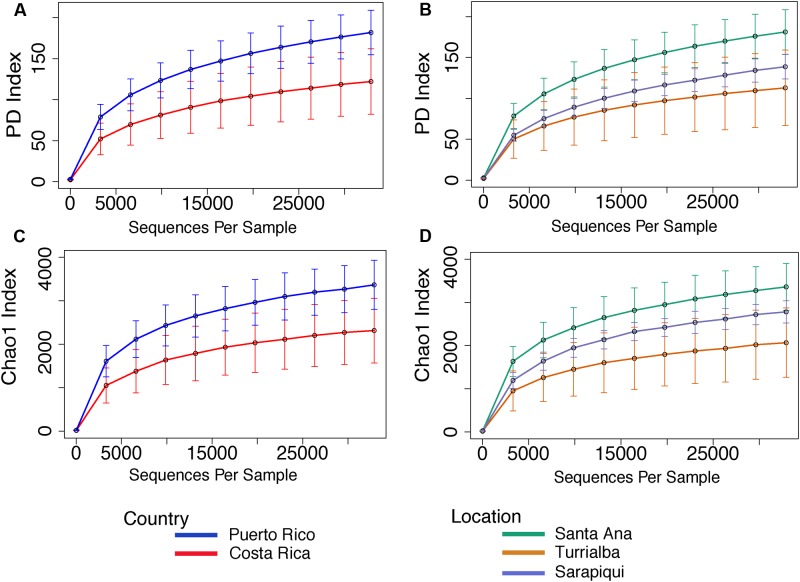
FIGURE 5.
Rarefaction curves for alpha diversity measures of Faith’s PD index (A,B) and Chao 1 richness index (C,D) comparing country and location. Error bars in the figures correspond to one standard deviation out from the average (n = 10 biological replicates in Puerto Rico/Santa Ana; n = 7 biological replicates Sarapiquí, and n = 4 biological replicates Turrialba). PD measures per comparing countries indicate a significantly higher diversity in Puerto Rico (t-test, t-stat = 3.621, p-value = 0.004). Comparisons per location indicate that Santa Ana (PR) has significantly higher diversity compared to Sarapiquí (CR) (t-test, t-stat = –3.594, p-value = 0.021). Richness was significantly higher in Santa Ana compared to Sarapiquí (t-test, t-stat = –3.714, p-value = 0.009) but not compared to Turrialba (t-test, t-stat = –1.883, p-value = 0.291). Rarefaction analyses were based on 32,900 sequences per sample type.

