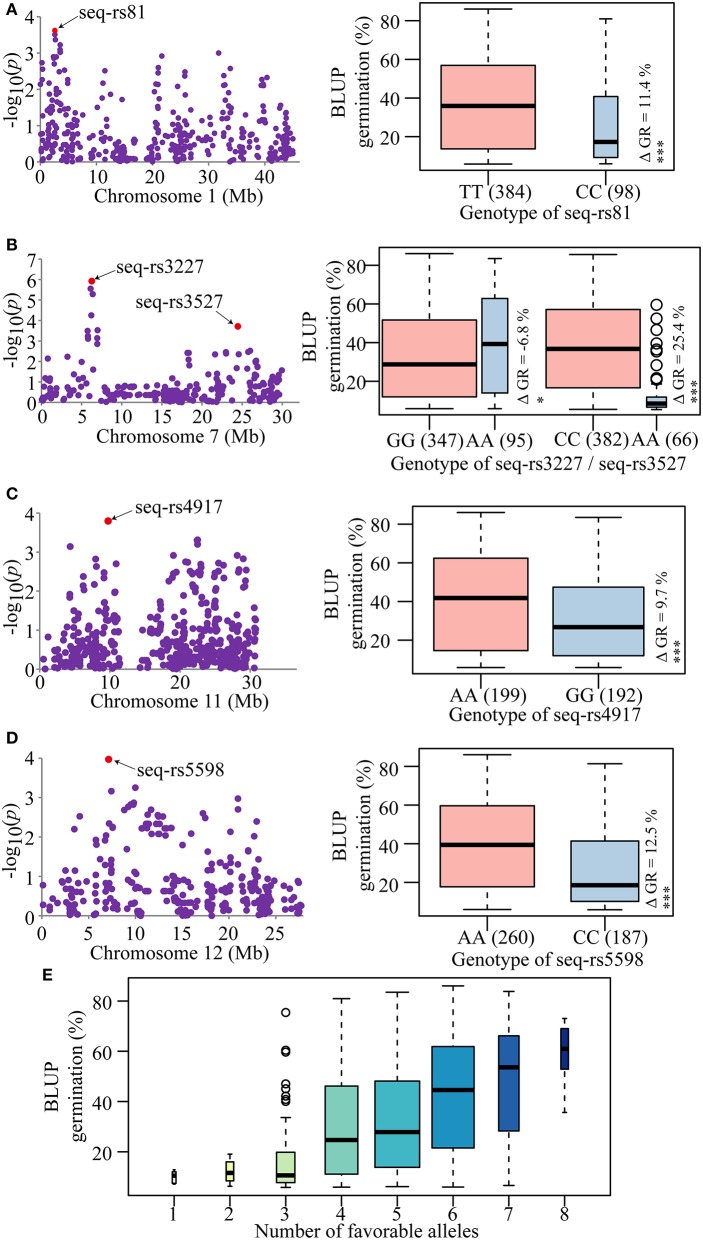
Figure 3.
Trait-associated SNPs and pyramiding of favorable alleles. (A–D) Candidate SNPs associated with seed dormancy and phenotypic differences between the two alleles of each SNP. Red dots represent the lead SNPs of candidate regions. The boxplots on the right show the distribution of average germination estimated by BLUP for each SNP allele. The number of individuals for each allele is given in parenthesis and is represented by the width of the box. Whiskers represent 1.5 times the quantile of the data. Individuals falling outside the range of the whiskers are shown as open dots. Differences in means are shown by ΔGR. *P = 0.05 and ***P = 0.001, respectively. (E) Pyramid effects for different numbers of favorable alleles of the candidate SNPs. The X-axis represents the number of elite alleles carried by the accessions and the Y-axis represents the trait mean value estimated by BLUP. The width of each boxplot represents the number of accessions.

