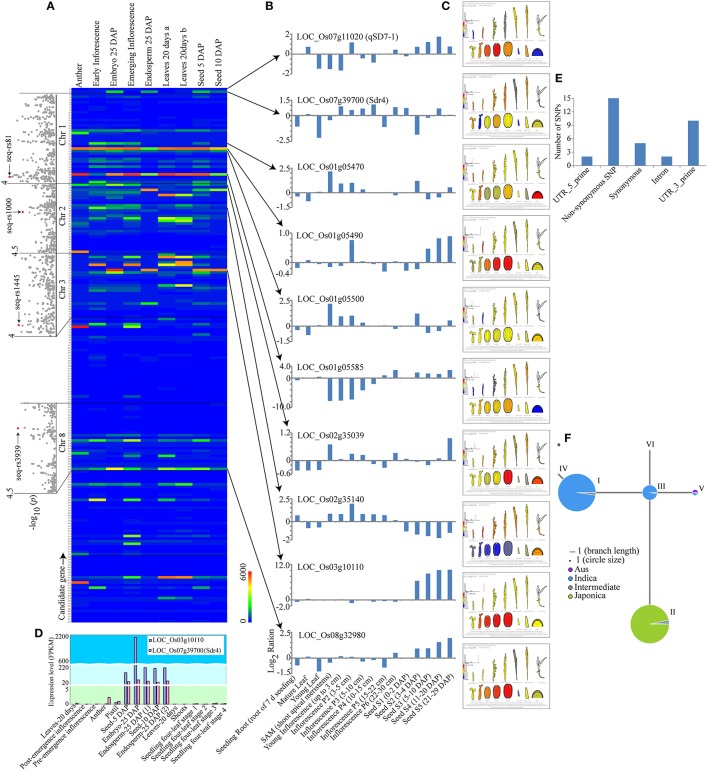
Figure 4.
GWAS analysis and candidate gene identification. (A) Genome-wide association signals and expression levels of the predicted genes of the lead SNPs. The positions of the peak SNPs are indicated by red dots. The expression level of each predicted gene is shown in the color index at the bottom right of the panel. (B) Expression pattern comparison between eight candidate genes and two known genes, qSD7-1 and Sdr4. (C) The expression pattern of each gene according to the Bio-Analytic Resource for Plant Biology expression database. Red and blue represent high and low relative expression levels in different tissues, respectively. (D) Gene expression pattern comparison between the candidate gene LOC_Os03g10110 and the known gene Sdr4 in different stages of seed development. (E) The presence of SNPs in the candidate gene LOC_Os03g10110 according to the public RiceVarMap database. (F) Haplotype network analysis using the public RiceVarMap database. Blue and green represent indica and japonica accessions, respectively.

