Figure 7.
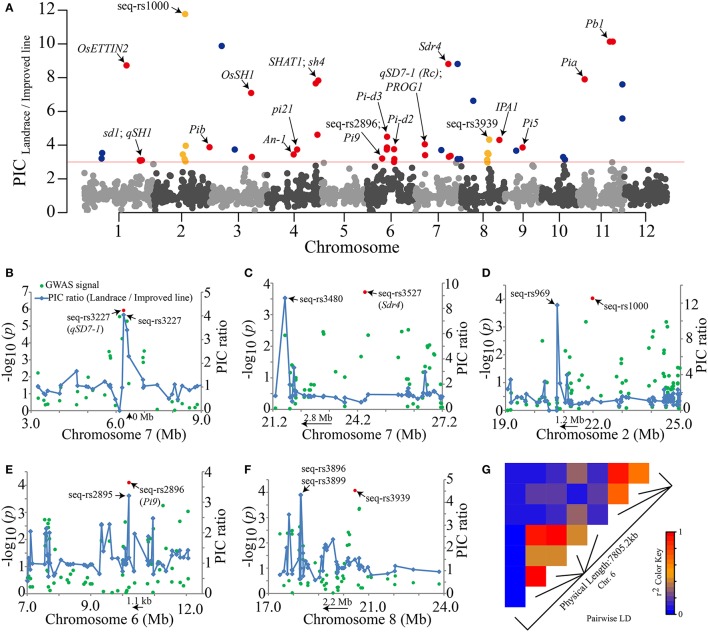
Visualization of genome-wide selection signals and the GWAS results. (A) Whole-genome screening of selection signals from rice improvement. The PIC ratio values are plotted against their positions on each of the 12 chromosomes. The red horizontal line indicates the threshold (PIC ratio = 3) for the selection signals. Previously reported genes, our GWAS lead SNPs and new putative selective sweeps (Table S9) are marked with red, yellow and dark blue dots, respectively. (B–F) Five GWAS results, including the two seed dormancy genes qSD7-1 and Sdr4, that are very close to strong selection signals. The peaks of blue lines and red dots represent selective sweep regions and GWAS signals, respectively. The orientations of the two known genes and selective sweep regions are indicated by arrows. (G) The extent of LD around the SNPs in multiple resistance genes on chromosome 6. The r2 values are indicated by the color key.

