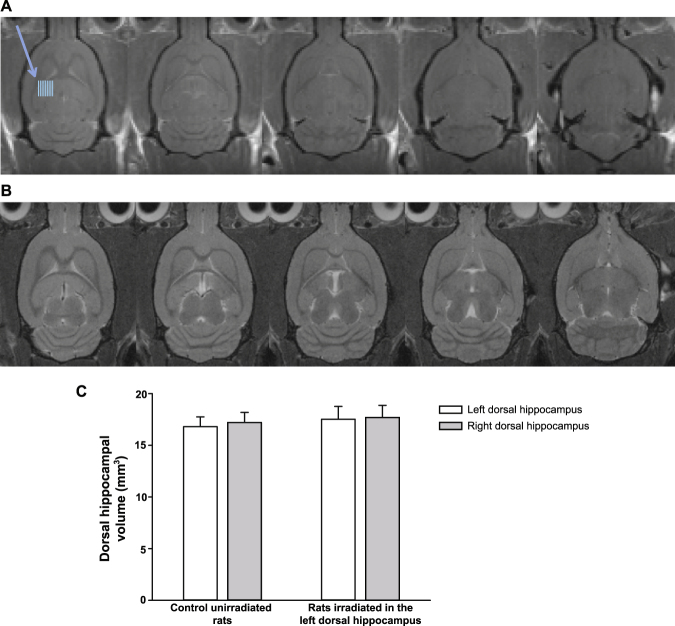
Figure 4.
MRI does not show any sign of radionecrosis or radio-induced edema. Representative T1-weighted post-contrast (A) and T2-weighted (B) MRI performed 3 months after irradiation of the left dorsal hippocampus are shown. Blue lines indicate the irradiation zone in the left dorsal hippocampus. Note the absence of any sign of brain damage induced by the microbeams (peak dose: 600 Gy). Quantification of left and right dorsal hippocampal volumes in control unirradiated rats and in irradiated rats. Values were calculated directly from the DICOM images and are the means ± SD (n = 2–4). Statistical analysis was performed by Two-Way ANOVA (p = 0.992, irradiation x brain area) (C).

