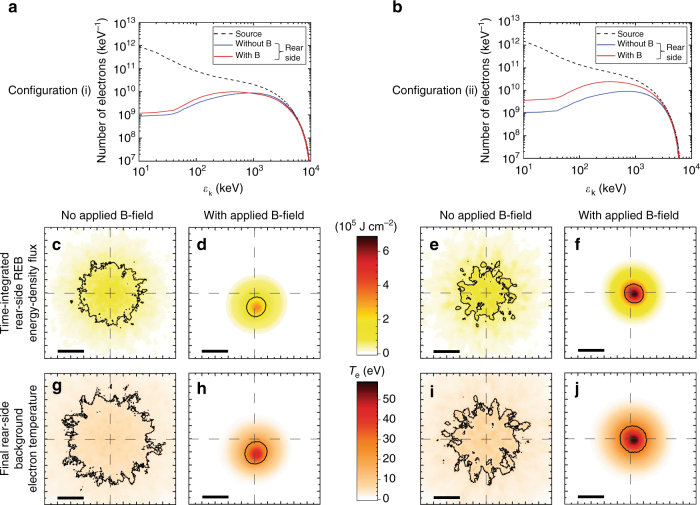
Fig. 3.
Relativistic electron beam features unfolded from transport simulations. The results, taken at the end of the 3D PIC-hybrid benchmarked simulation runs, are plotted for target-position configurations (i) on the left and (ii) on the right, without and with B-field. a, b Time-integrated relativistic electron beam (REB) energy spectra at the targets’ front side (source, dashed lines) and rear side (full lines, red with imposed B-field, blue without B-field). c–f Time-integrated REB energy-density flux at the targets’ rear surface. g–j Final background electron temperature at the targets’ rear surface. In c–j the black bars stand for the 40 μm spatial scale, the contour lines correspond to the half-height of the signals and the crossed dashed lines indicate the position of REB injection at the targets’ front surface

