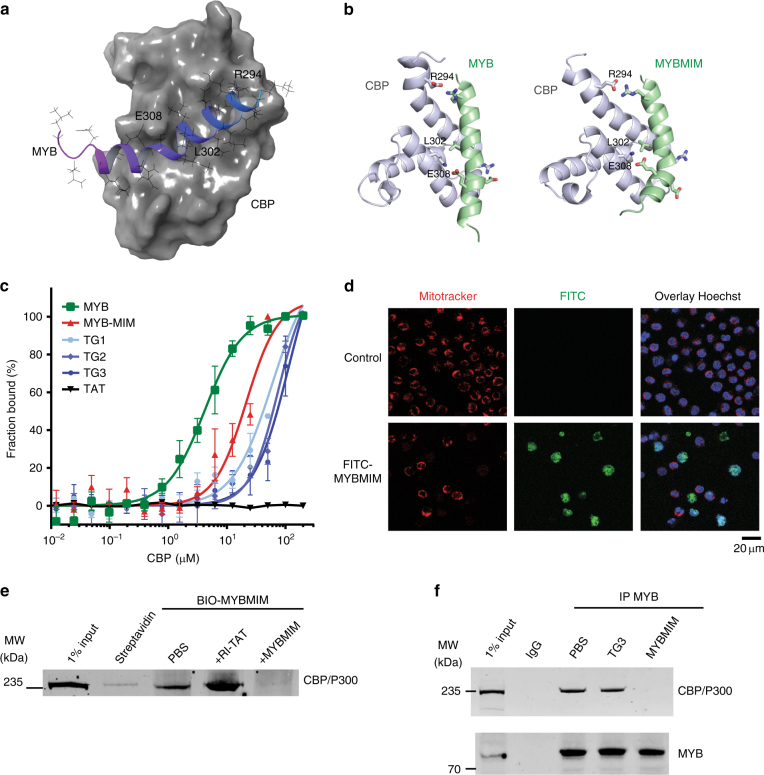
Fig. 1.
MYBMIM disrupts the MYB:CBP complex in AML cells. a Molecular structure of the complex of the transactivation domain of MYB (blue) with the KIX domain of CBP (gray)23 assembled in Maestro (Schrödinger). MYB residues making contacts with CBP are labeled as indicated. (PDB: 1SB0). b Molecular structures of the transactivation domain of MYB (left, green) and MYBMIM (right) in complex the KIX domain of CBP (gray), as modeled using replica exchange molecular dynamics. Both MYBMIM and MYB retain E308 and R294 salt bridge and L302 hydrophobic interactions, as marked by sidechain representation. c Binding of FITC-conjugated MYB (green), MYBMIM (red), compared to control TG1, TG2, TG3, and TAT (black), as measured using microscale thermophoresis (Kd = 4.2 ± 0.5 µM and 21.3 ± 2.9 µM for MYB and MYBMIM, respectively, 59.2 ± 12.4 µM for TG1, 75.1 ± 12.5 µM for TG2 and 113.5 ± 36.6 µM for TG3). Error bars represent standard error mean of three biological replicates. d Live cell confocal fluorescence microscopy photographs of MV-411 cells treated with 50 nM FITC-MYBMIM (green) for 1 h, as visualized using Mitotracker (red) and Hoechst 33342 (blue). Scale bar indicates 20 μm, with z-stack of 1.5 μm. e Western blot showing comparable binding of cellular CBP/P300 to streptavidin bead-immobilized BIO-MYBMIM, specifically competed by 20-fold excess free retro-inverso TAT (RI-TAT) and MYBMIM peptides, as indicated by + signs. f Representative western blot of MYB:CBP/P300 complex immunoprecipitated from MV411 cells disrupted 20 μM MYBMIM and TG3, as indicated

