Fig. 2.
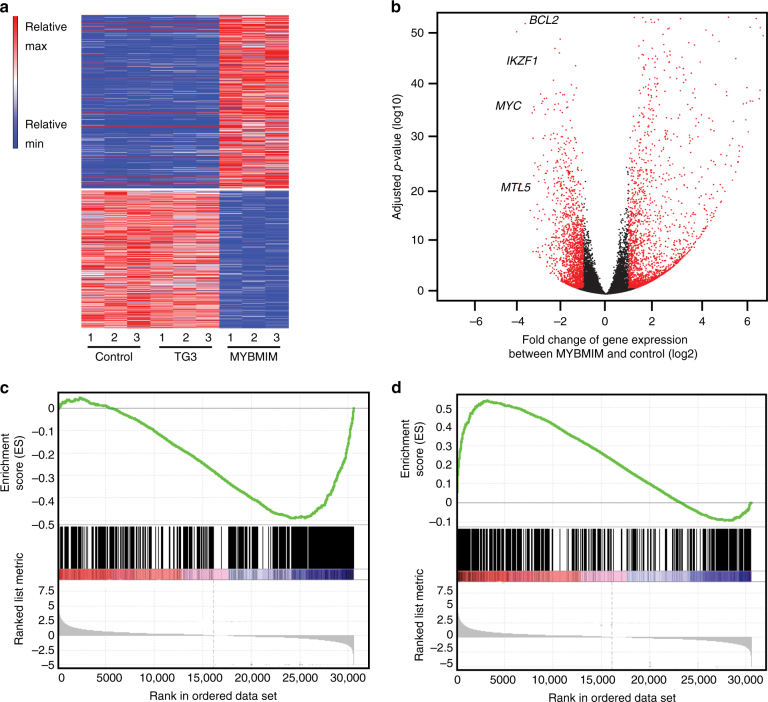
MYBMIM regulates MYB enhancers and promoters and MYB-dependent target genes. a Heatmap of changes in normalized gene expression of MOLM13 cells treated with 20 µM MYBMIM versus TG3 control for 6 h, as analyzed by RNA-seq of three biological replicates. b Volcano plot of normalized gene expression, with BCL2, IKZF1, MYC and MTL5 as indicated. c, d Gene set enrichment analysis of downregulated c and upregulated d genes with respect to MYB target genes, as defined by8. NES = −2.47 and 2.09, and q = 0 and 0, respectively

