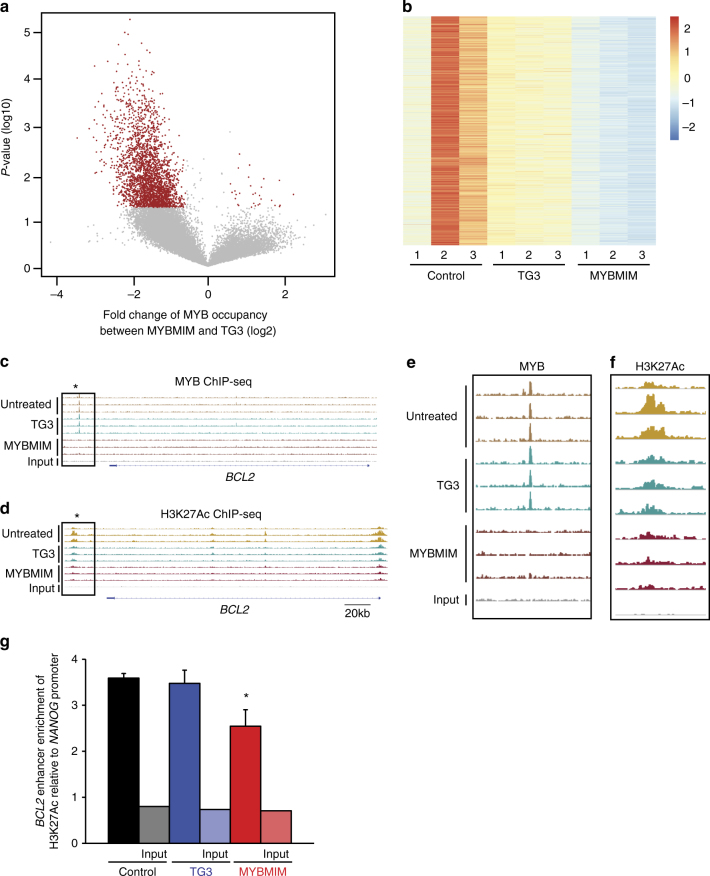
Fig. 3.
MYBMIM suppresses the assembly of chromatin complexes. a Volcano plot of MYB occupancy in MV-411 cells treated with 20 µM MYBMIM versus TG3 control for 6 h, as analyzed by MYB ChIP-seq. p-values denote t-test statistical significance of 3 biological replicates. b Heatmap of changes in H3K27Ac occupancy of MV411 treated with 20 µM MYBMIM versus TG3 control for 24 h, as analyzed by ChIP-seq of three biological replicates. c Genome track of the BCL2 locus showing elimination of the MYB-bound enhancer (star) upon treatment with MYBMIM, but not control or TG3 treatment. d Genome track of the BCL2 locus showing elimination of the H3K27Ac-bound enhancer (star) upon treatment with MYBMIM, but not control or TG3 treatment. e Magnified boxed area of MYB-bound enhancer peak shown in 3c. f Magnified boxed area of H3K27Ac-bound enhancer peak shown in (d). g Analysis of relative enrichment of H3K27Ac at the BCL2 enhancer locus compared to NANOG, as measured by ChIP-PCR upon treatment with control PBS (black), 20 μM TG3 (blue), and 20 μM MYBMIM (red) for 24 h. Error bars represent standard deviations of three biological replicates. * p = 8.6e–3 when compared to untreated control

