Figure 3.
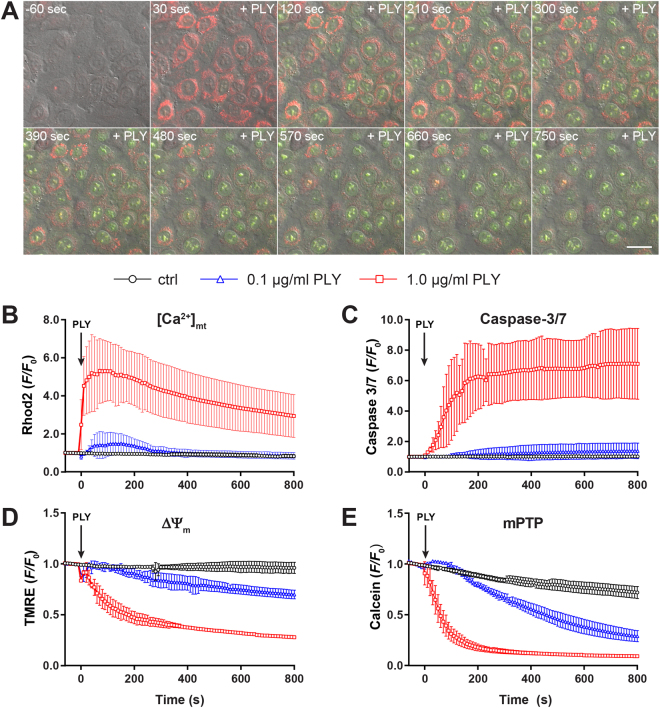
The effect of PLY on mitochondrial calcium, caspase-3/7 activation, membrane potential and opening of mPTP. (A) Representative time-lapse images of A549 cells loaded with the mitochondrial calcium sensor Rhod2-AM (red) and stimulated with 1.0 µg/ml PLY in the presence of the caspase-3/7 sensor (green). Scale bar represents 25 µm. (B) Quantification of mitochondrial calcium changes (Rhod2 F/F0 ratios) in cells stimulated with 1.0 µg/ml and 0.1 µg/ml PLY or left untreated (mean ± SD from n = 5 independent experiments). (C) Quantification of caspase-3/7 induction (F/F0 ratios) in cells stimulated with PLY as described above or left untreated (mean ± SD from n = 3 independent experiments). (D) Quantification of changes in mitochondrial membrane potential (TMRE F/F0 ratios) in cells stimulated with PLY as described above or left untreated (mean ± SD from n = 3 independent experiments). (E) Opening of the mPTP (F/F0 ratios) in cells stimulated with the indicated amount of PLY or left untreated (mean ± SD from n = 3 independent experiments).

