Figure 2.
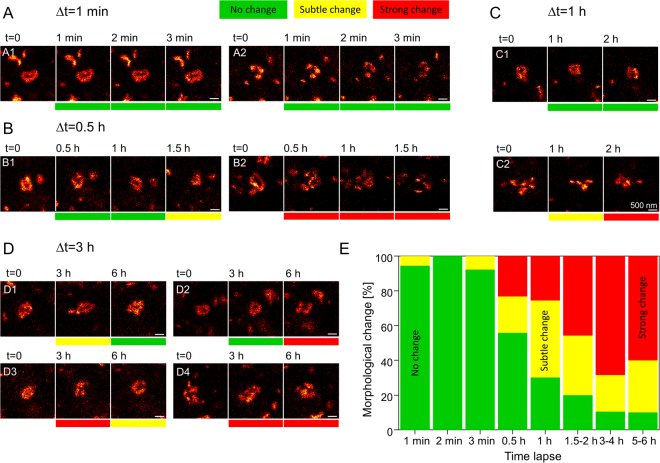
Morphology of large PSD95 assemblies changes within hours. (A–D) STED microscopy image of a selection of large protein assemblies recorded at different time intervals in the visual cortex of an anaesthetised mouse. The morphology is very diverse; many assemblies are smooth ring-like (A1, B1, B2 at t = 0, C1, D1, D2, D3), some are clustered (A2, B2 at 1.5 h, C2, D4); the cluster can be arranged in horse-shoe (A2), ring-like (C2 at 2 h, D4 at 6 h) or arbitrary (B2 at 1.5 h, C2 at 0 h, D4 at 0 h) shape. Shape changes were categorized as no changes (green), subtle changes (yellow) or strong morphological changes (red). All changes refer to t = 0. (A) Within minutes the morphology is not changing. (B) After 0.5 h assemblies can be rather stable (B1) or change strongly (B2). (C) Over 2 h assemblies can be stable (C1) or undergo morphological change (C2). (D) Assemblies can change and reverse to the original structure (D1), are stable after 3 h and changed after 6 h (D2), or undergo multiple changes (D3, D4). (E) Stacked histogram of relative frequencies of morphological changes of PSD95 assemblies; changes refer always to t = 0. Number of protein assemblies analysed: 18 (1 min), 18 (2 min), 13 (3 min), 43 (0.5 h), 43 (1 h), 35 (1.5–2 h), 19 (3–4 h), 10 (5–6 h) of n = 4 mice. All analysed protein assemblies can be found in the supplementary data. Scale bars 500 nm.

