Figure 3.
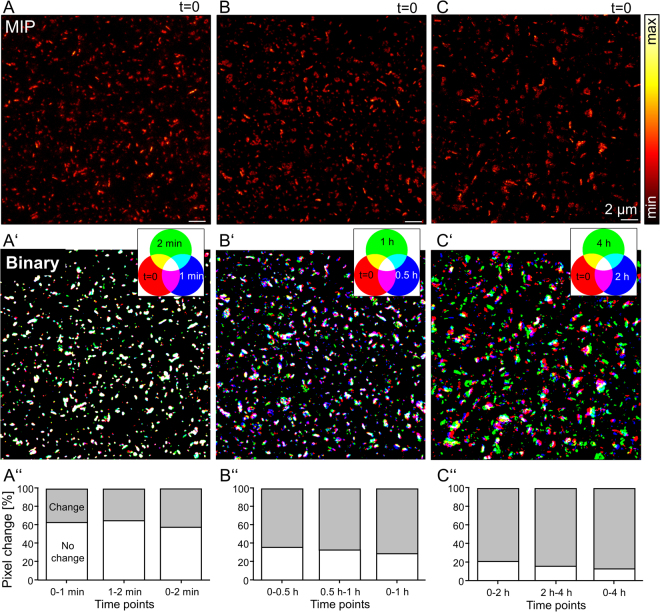
Mapping PSD95 assemblies over several hours in an anaesthetised mouse. (A,B,C) Maximum intensity projections of STED microscopy z-stacks at different areas in the visual cortex which were repetitively imaged at different time intervals of 1 min, 0.5 h and 2 h. (A’) RGB overlay of three binary images created from maximum intensity projections (MIP) at time point 0 (shown in A) (red), after 1 min (blue) and after 2 min (green). (B’) RGB overlay of binary images of MIPs recorded at t = 0 (created from B) (red), t = 0.5 h (blue), and t = 1 h (green). (C’) RGB overlay of binary images of MIPs recorded at t = 0 (created from C) (red), t = 2 h (blue) and t = 4 h (green). Overlapping colour areas are as indicated on each colour wheel. (A”–C”) Percent of pixels which do not change between two time points averaged over the whole binary image above. (A”) ~60% of the pixel of all assemblies in A’ at t = 0 overlap with the assemblies at t = 1 min (0–1 min) and correspondingly between t = 1 min and t = 2 min (1–2 min) and t = 0 min with t = 2 min (0–2 min). (B”) Only <40% of pixels of the assemblies in B’ show an overlap between 0 and 1 h, and ~20% after 4 h (C”). Scale bars 2 µm.

