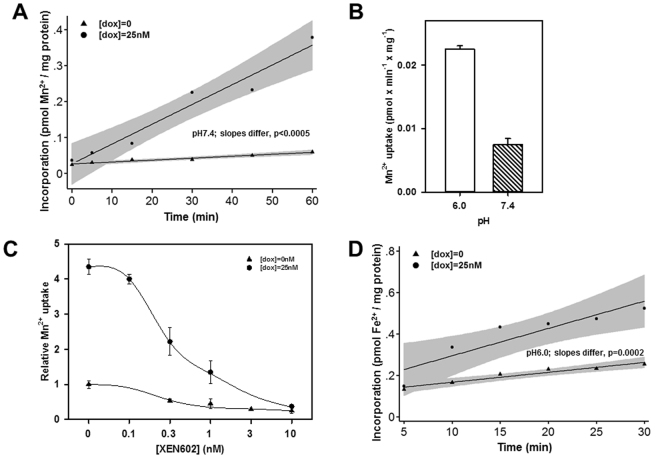
Figure 6.
Mitochondrial Mn2+ and Fe2+ uptake in rDMT1-overexpressing HEK293 cells is consistent with DMT1.Mitochondria were isolated from uninduced ([dox] = 0) or induced ([dox] = 25 nM) rDMT1-HEK293 cells for all 4 panels. (A) Time course for Mn2+ uptake. Mitochondria were exposed to 0.5 µM 54Mn2+ at pH 7.4 and incorporation determined as described in the Methods. Lines were fitted by regression; shading indicates 95% confidence intervals. This plot is representative of 3 separate experiments after which all remaining 54Mn2+ experiments were at pH 6.0. (B) pH dependence of Mn2+ uptake. Mitochondria were exposed to 0.5 µM 54Mn2+ at pH 6.0 and 7.4 then incorporation was determined like in (A). Only mitochondria from cells exposed to 25 nM doxycycline were analysed. The slope for each plot and the standard error of the estimate (SEE) for the slope were calculated as in (A) then plotted as Mn2+ uptake and error bars for these values. This plot is representative of 2 separate experiments. (C) Inhibition of mitochondrial Mn2+ incorporation by XEN602, a specific DMT1 inhibitor. Mitochondria were exposed to 0.5 µM 54Mn2+ at pH 6.0 and incorporation determined like in (B) except that incubations included XEN602 concentrations as indicated. The slope for each plot and the SEE for the slope were calculated as in (A) then plotted here as relative Mn2+ uptake with uninduced and uninhibited uptake (1.8 pEq Mn × min−1 × mg−1 protein) set as 1.0 and error bars for these values. This plot is representative of 2 separate experiments. (D) Time course for Fe2+ uptake. Mitochondria were exposed to 2 µM 59Fe2+ at pH 6.0 and incorporation was determined as described in the Methods. Lines were fitted by regression; shading indicates 95% confidence intervals. This plot is representative of 6 separate experiments.

