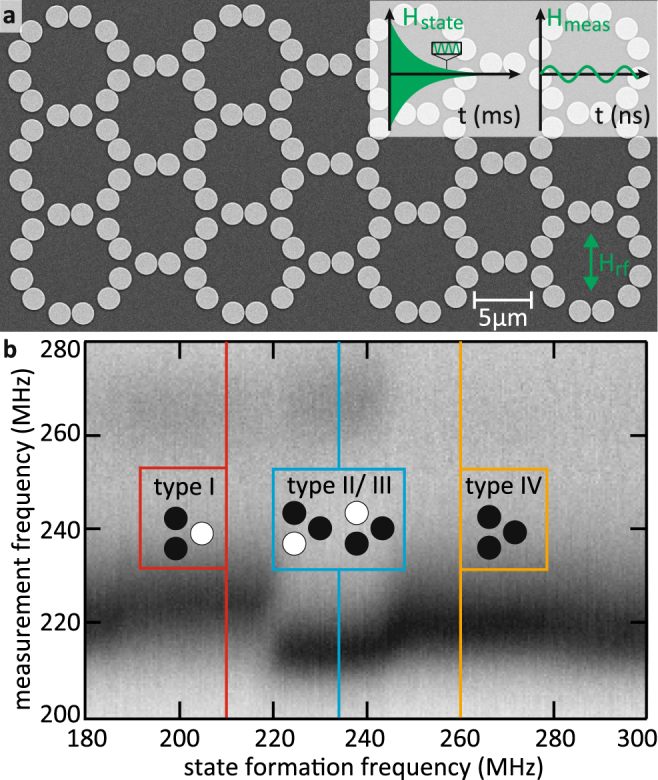
Figure 2.

Scanning electron micrograph of the sample and FMR measurements. (a) Scanning electron micrograph of the investigated sample. A copper stripline (not shown) is placed upon the permalloy disks to excite the gyrational motion of the vortices. The polarization pattern is tuned via an adiabatic reduction of a high frequency magnetic field excitation of maximum μ 0 H state ≈ 0.7 mT. A low-amplitude harmonic field μ 0 H meas ≈ 0.1 mT excites the vortices during the FMR and STXM measurements. (b) Ferromagnetic absorption spectra for varying state formation frequencies. The insets show the most common triple types for a state formation frequency of 210 MHz (red), 234 MHz (blue), and 261 MHz (orange). The resonance frequency of an isolated vortex is 247 MHz.
