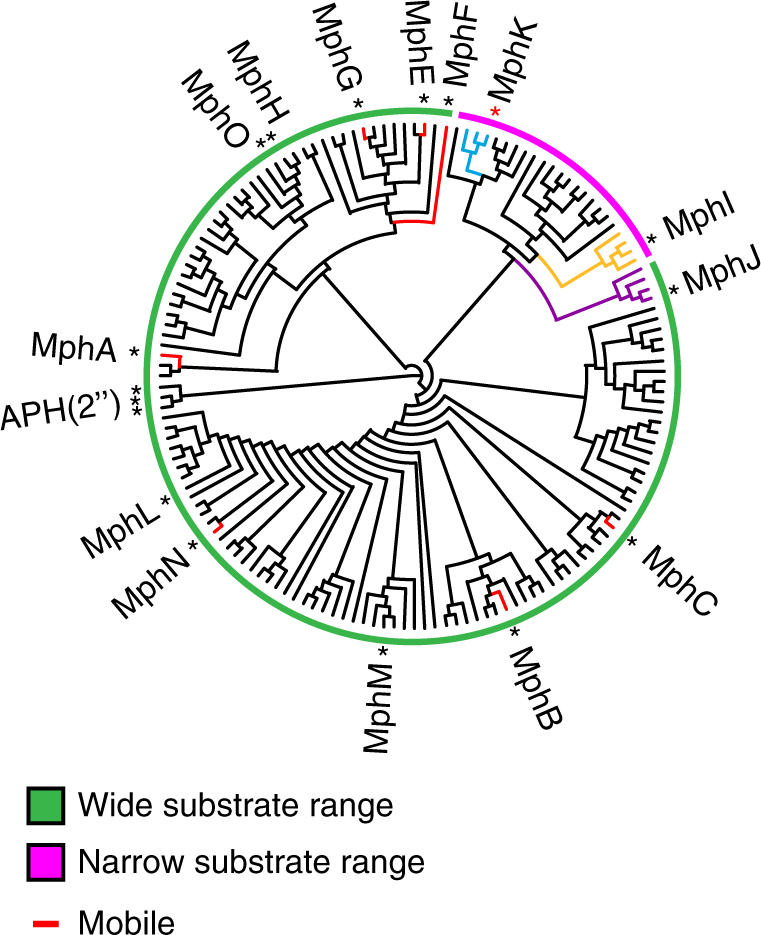
Fig. 2.

Phylogenetic reconstruction of macrolide phosphotransferases. Colored bars represent predicted substrate specificity based on phylogenetic clustering of known Mphs and their homologs. Asterisks represent experimentally validated Mphs, and the red asterisk represents MphK, which was identified from this analysis as a Mph that does not confer C3 cladinose macrolide resistance. Colored portions of the phylogenetic tree highlight clusters of interest. Mphs captured on mobile genetic elements are colored red. The tree is presented as a cladogram, and the root drawn with GTP-dependent APH(2”) enzymes as outgroups. A cladogram with complete labels and bootstrap values can be found in Supplementary Figure 2
