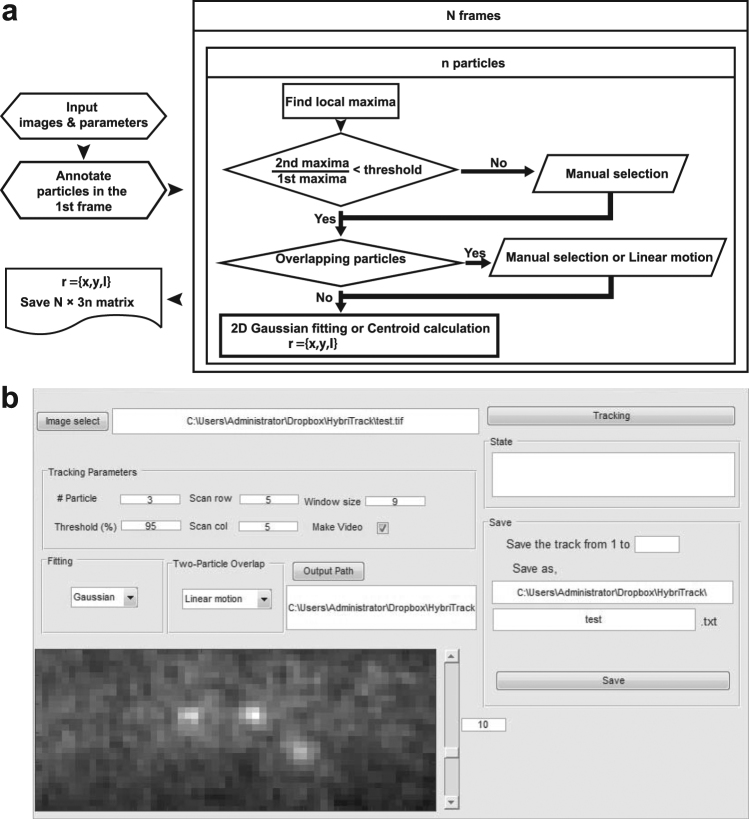
Figure 1.
Flow chart and graphical user interface (GUI) of HybTrack. (a) Tracking is started by selecting the image and setting input parameters. The user needs to annotate particles to track in the first image frame. Based on the initial positions, the tracking algorithm proceeds to search for local maxima and calculates the sub-pixel coordinates. If the local maxima is not bright enough, a pop-up window appears for manual detection of the particle. If there are overlapping particles within the scan region, two options are provided, Manual selection or Linear motion. This process is repeated for all annotated particles and image frames. (b) GUI interface of HybTrack. After setting the parameters, tracking process is started, and the result is saved as a text file.

